Question-and-Answer Resource for the Building Energy Modeling Community
Get started with the Help page
Ask Your Question
1

Why incorrect dates on horizontal axis in Results Viewer eso plots?

asked 2017-04-24 15:40:33 -0500

JustinLueker's avatar

updated 2017-09-25 15:14:42 -0500

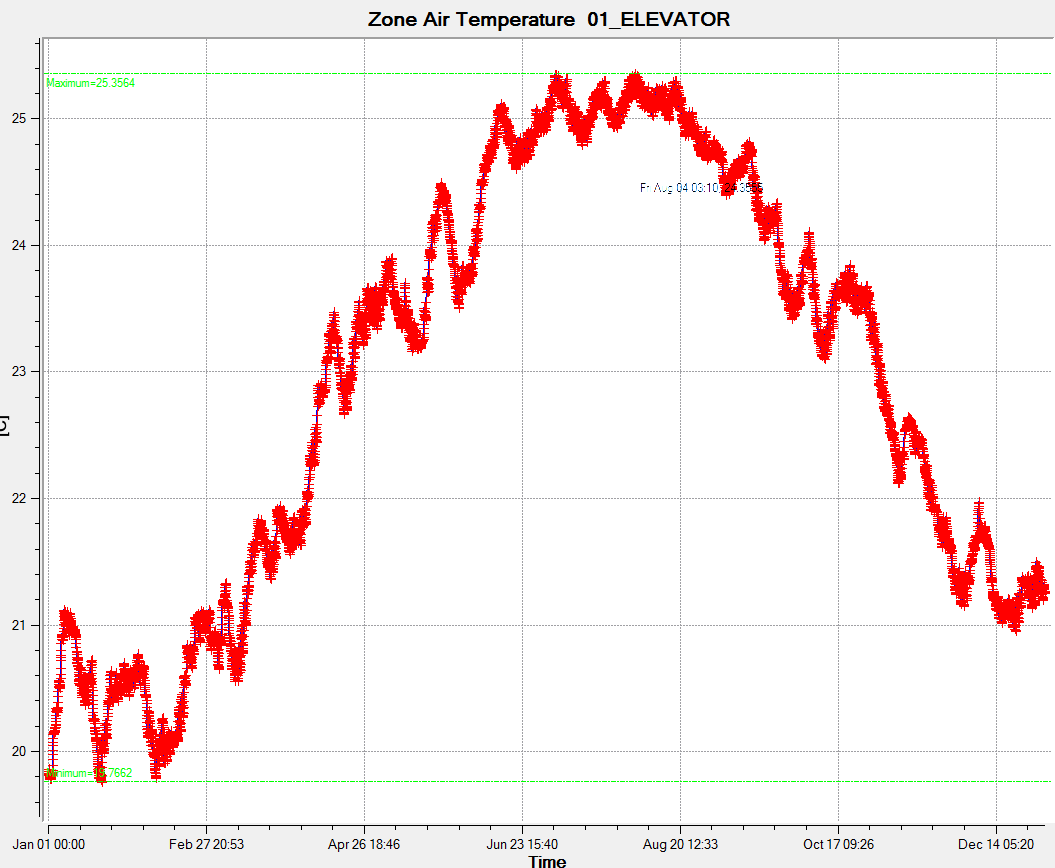
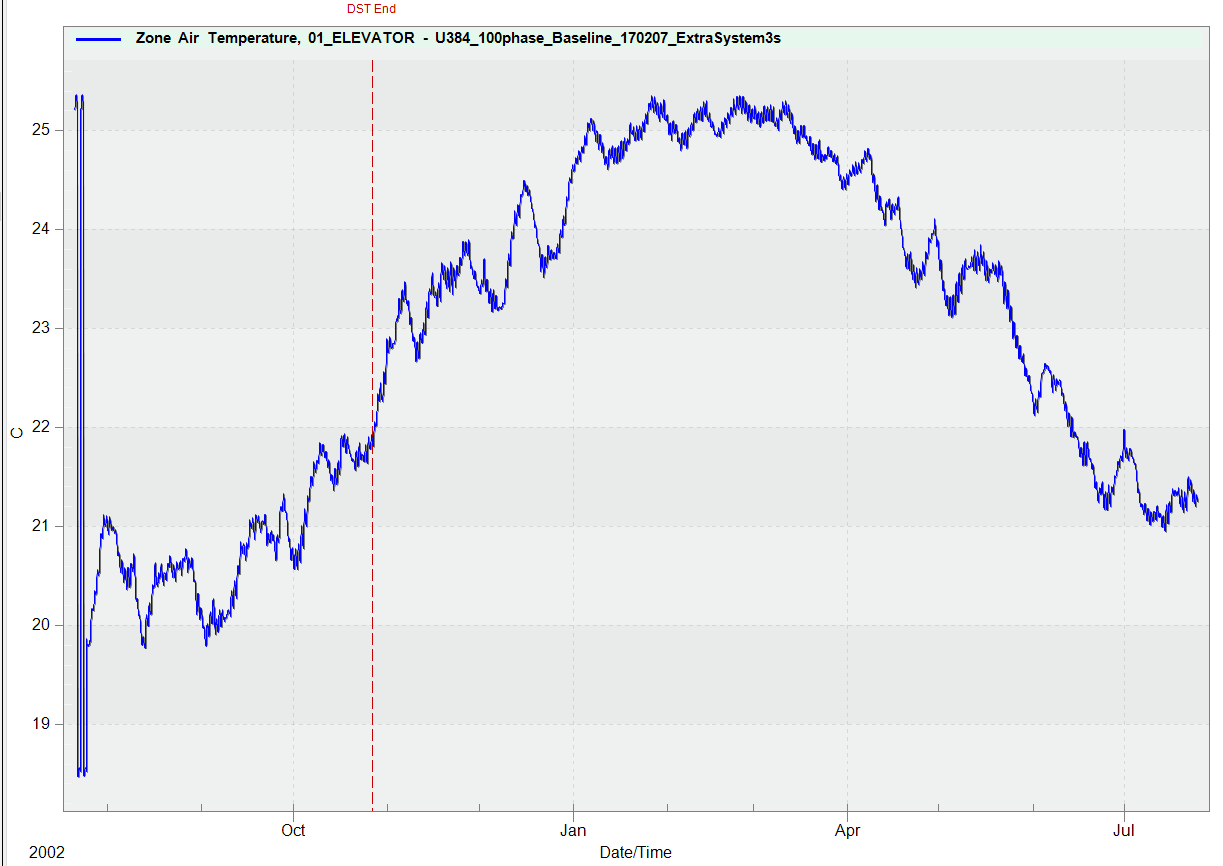
I'm viewing my ESO files in both xEsoView and DesignBuilder Results Viewer. xEsoView displays graphs with the correct run period (January-December) but for some reason Results Viewer defaults to displaying graphs with incorrect dates on the horizontal axis- the same run period, but it labels the axis August-July. Any suggestions for correcting the dates in Results Viewer? See screenshots below (xExoView on top, Results Viewer on bottom)

image description image description

edit retag flag offensive close merge delete

2 Answers

Sort by ยป oldest newest most voted
3

answered 2017-04-25 13:40:20 -0500

updated 2017-04-25 14:32:50 -0500

It looks like there are some strange "spike" behavior in the first portion of the DesignBuilder Results Viewer screen shot. This makes me think that the ESO file you've loaded contains data for the summer design day in July as well as the annual simulation. Results Viewer probably isn't separating those periods (design day vs annual) correctly and showing the annual results right after the design day results. I've seen this occur in DView as well when viewing some ESO files.

I think the main reason for this is that in DesignBuilder, you generate IDFs that are either heating design day, cooling design day, or annual (or whatever run period you select). Since this is the approach, DesignBuilder's Results Viewer tool may not have a check for different run periods (i.e., design day vs. annual), and instead be "hard-wired" to show all results from the loaded ESO and lump them into one continuous span of time.

Looking at your comparison to xEsoView, then I would recommend using that tool instead of DesignBuilder's Results Viewer tool (especially if this ESO was generated outside of DesignBuilder for a single simulation that is a combination of design day and annual periods).

edit flag offensive delete link more

Comments

Hey Aaron- you're definitely onto something with the design day being lumped with the annual results. I should have clarified- I'm having trouble with the DesignBuilder Results Viewer. I believe your screenshots come from the OpenStudio tool of the same name. Do you have experience with the DesignBuilder tool?

JustinLueker's avatar JustinLueker  ( 2017-04-25 13:50:16 -0500 )edit

@JLueker ah, I should have caught that from your screen shot. I have used DesignBuilder's Results Viewer before as well as DesignBuilder itself. I've updated my original answer above.

Aaron Boranian's avatar Aaron Boranian  ( 2017-04-25 14:31:37 -0500 )edit
3

answered 2017-04-26 02:32:14 -0500

Andy Tindale's avatar

updated 2017-04-26 02:59:30 -0500

From what I can see in the above graphs Aaron is exactly right. The current version of DesignBuilder Results Viewer is not designed to read results from multiple EnergyPlus run periods and the spikes at the beginning of the result sets and the dates on the x-axis are caused by this.

You will never see this behaviour when running the RV using DesignBuilder results for the reasons Aaron explains.

We have an enhancement on our development list to address this in a future release.

edit flag offensive delete link more

Your Answer

Please start posting anonymously - your entry will be published after you log in or create a new account.

Add Answer

Careers

Question Tools

1 follower

Stats

Asked: 2017-04-24 15:40:33 -0500

Seen: 339 times

Last updated: Apr 26 '17