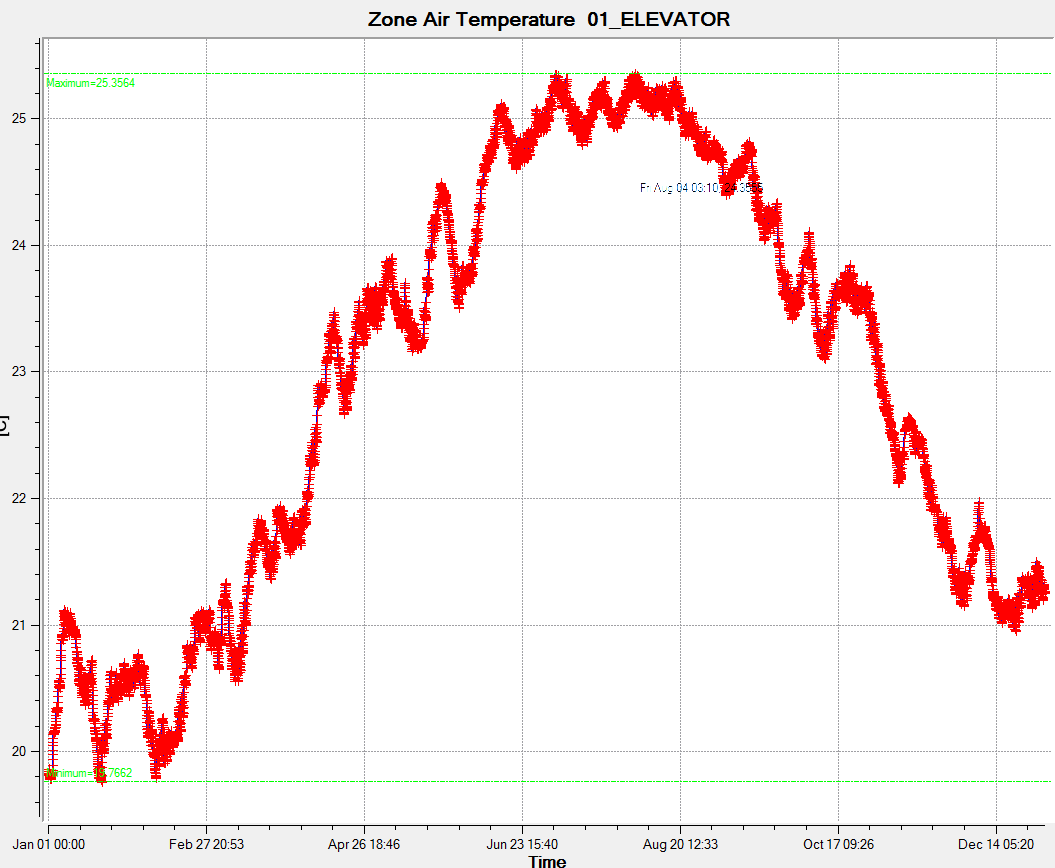
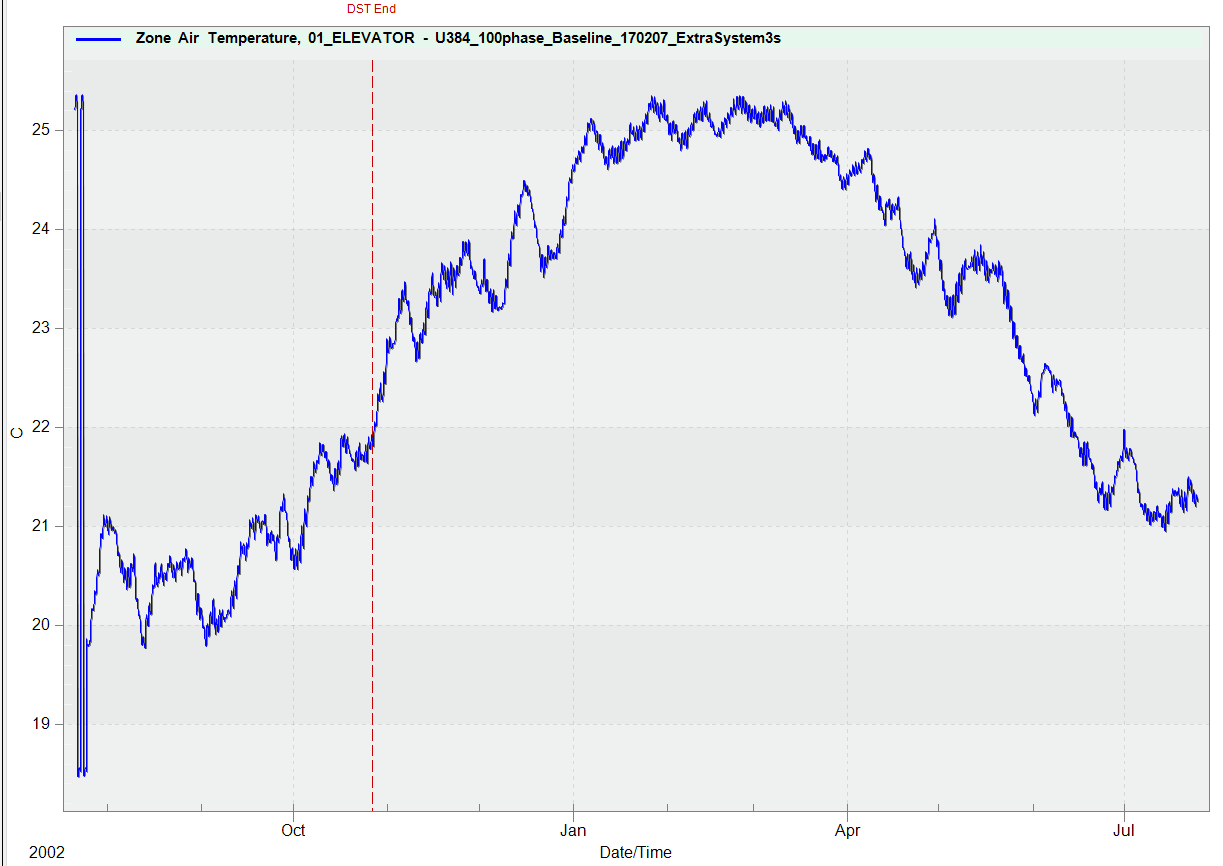
I'm viewing my ESO files in both xEsoView and Results Viewer. xEsoView displays graphs with the correct run period (January-December) but for some reason Results Viewer defaults to displaying graphs with incorrect dates on the horizontal axis- the same run period, but it labels the axis August-July. Any suggestions for correcting the dates in Results Viewer? See screenshots below.