Question-and-Answer Resource for the Building Energy Modeling Community
First time here? Check out the Help page!
| | 1 | initial version |
It looks like there are some strange "spike" behavior in the first portion of the Results Viewer screen shot. This makes me think that the ESO file you've loaded contains data for the summer design day in July as well as the annual simulation. Results Viewer probably isn't separating those periods (design day vs annual) correctly and showing the annual results right after the design day results. I've seen this occur in DView as well when viewing some ESO files.
In Results Viewer, you should have the option to plot an output variable on either the design day or annual simulations separately by selecting the "Environment Period". I've included two screen shots to show where to find this in both Table View and Tree View.
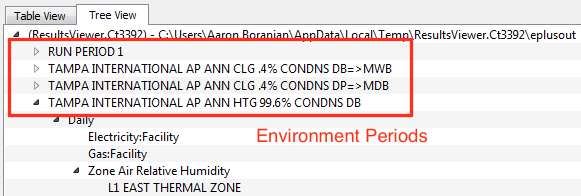
Setting environment period in Tree View of Results Viewer
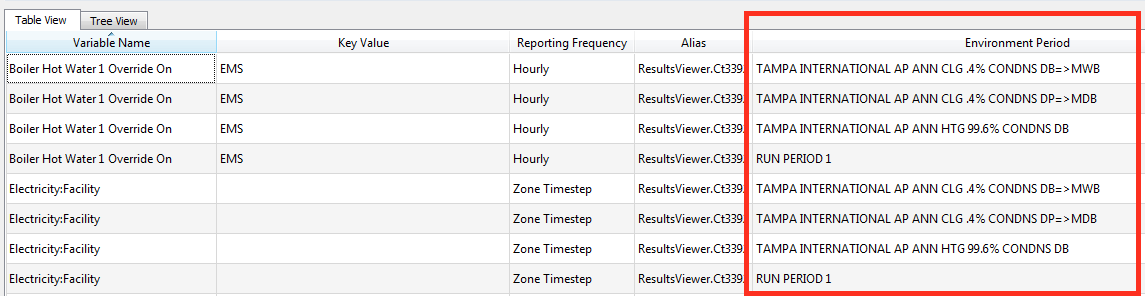
Setting environment period in Table View of Results Viewer
| | 2 | No.2 Revision |
It looks like there are some strange "spike" behavior in the first portion of the DesignBuilder Results Viewer screen shot. This makes me think that the ESO file you've loaded contains data for the summer design day in July as well as the annual simulation. Results Viewer probably isn't separating those periods (design day vs annual) correctly and showing the annual results right after the design day results. I've seen this occur in DView as well when viewing some ESO files.
In Results Viewer, I think the main reason for this is that in DesignBuilder, you should have the option to plot an output variable on generate IDFs that are either the heating design day day, cooling design day, or annual simulations separately by selecting (or whatever run period you select). Since this is the "Environment Period". I've included two screen shots approach, DesignBuilder's Results Viewer tool may be "hard-wired" to show where to find this in both Table View all results and Tree View.lump them into one continuous span of time.
Setting environment period in Tree View of Results Viewer
Setting environment period in Table View of Results Viewer
| | 3 | No.3 Revision |
It looks like there are some strange "spike" behavior in the first portion of the DesignBuilder Results Viewer screen shot. This makes me think that the ESO file you've loaded contains data for the summer design day in July as well as the annual simulation. Results Viewer probably isn't separating those periods (design day vs annual) correctly and showing the annual results right after the design day results. I've seen this occur in DView as well when viewing some ESO files.
I think the main reason for this is that in DesignBuilder, you generate IDFs that are either heating design day, cooling design day, or annual (or whatever run period you select). Since this is the approach, DesignBuilder's Results Viewer tool may not have a check for different run period, and instead be "hard-wired" to show all results from the loaded ESO and lump them into one continuous span of time.
Looking at your comparison to xEsoView, then I would recommend using that tool instead of DesignBuilder's Results Viewer tool (especially if this ESO was generated outside of DesignBuilder for a single simulation that is a combination of design day and annual periods).
| | 4 | No.4 Revision |
It looks like there are some strange "spike" behavior in the first portion of the DesignBuilder Results Viewer screen shot. This makes me think that the ESO file you've loaded contains data for the summer design day in July as well as the annual simulation. Results Viewer probably isn't separating those periods (design day vs annual) correctly and showing the annual results right after the design day results. I've seen this occur in DView as well when viewing some ESO files.
I think the main reason for this is that in DesignBuilder, you generate IDFs that are either heating design day, cooling design day, or annual (or whatever run period you select). Since this is the approach, DesignBuilder's Results Viewer tool may not have a check for different run period, periods (i.e., design day vs. annual), and instead be "hard-wired" to show all results from the loaded ESO and lump them into one continuous span of time.
Looking at your comparison to xEsoView, then I would recommend using that tool instead of DesignBuilder's Results Viewer tool (especially if this ESO was generated outside of DesignBuilder for a single simulation that is a combination of design day and annual periods).


