Question-and-Answer Resource for the Building Energy Modeling Community
Get started with the Help page
Ask Your Question
8

extrapolating performance curves for VRF systems

asked 2015-07-06 09:56:33 -0500

Waseem's avatar

updated 2015-07-10 20:58:44 -0500

I have been trying to create performance curve for a VRF system. I have followed Richard's paper to create them. I am misunderstanding the way extrapolation is done. The way I extrapolated is;

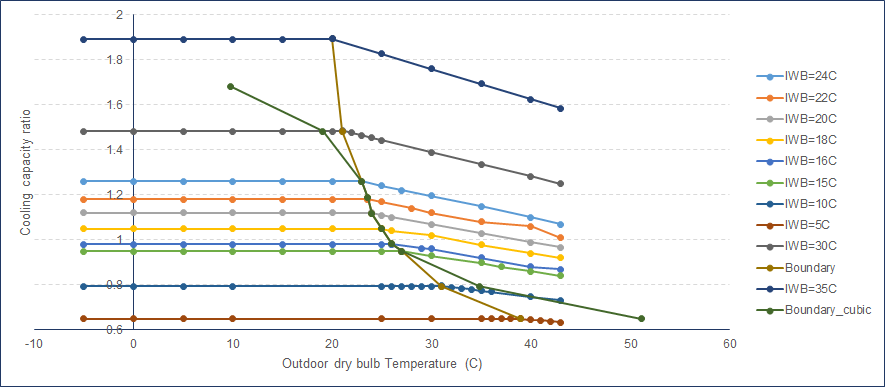
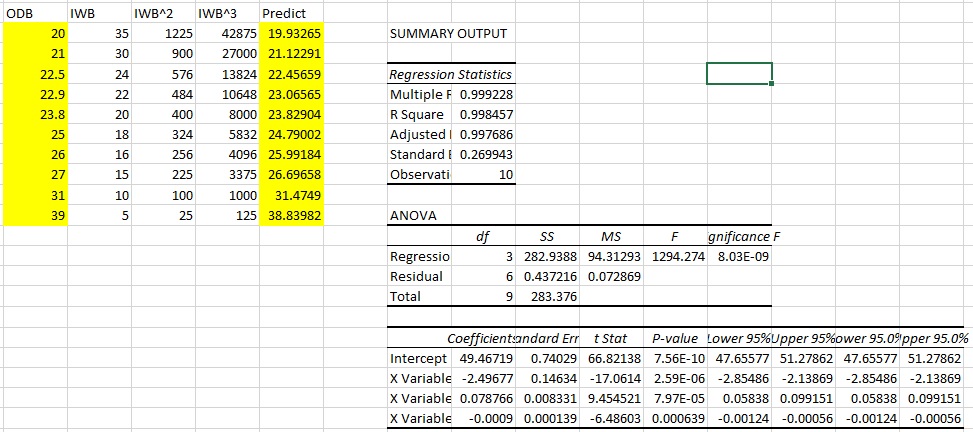
1) Use Cooling capacity ration function for Low and high temperatures to predict CAPFT (predicted) for all temperature range (e.g. -5C to -43C) for both these curves.

2) Finding the intersection of these curves (or very close points) and taking that ODB (outdoor dry-bulb) as a boundary curve point for a particular indoor wet-bulb temperature. However, by doing this I don't have any discontinuity (as points do tend to nearly overlap/intersect).

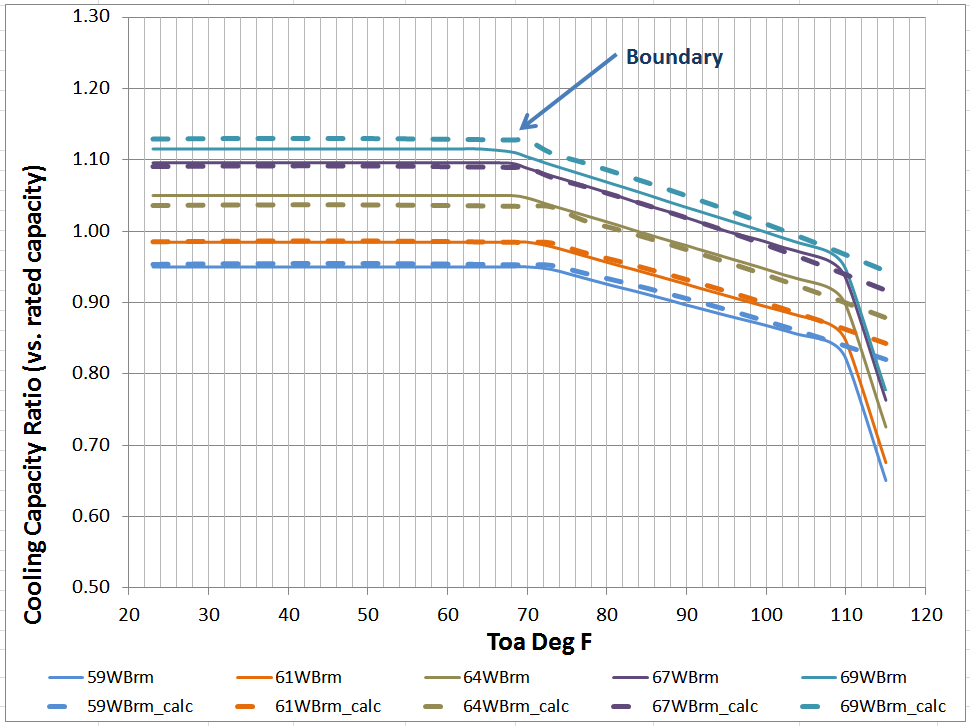
3) In order to plot boundary curve, I used cooling capacity ratio boundary curve to predicted ODB for each extrapolated IWB e.g. 5C, 10C IWB etc. Then, I used that predicted temperature to calculate predicted CAPFT. Please see attached performance curve for cooling. The cubic curve does not even touch/intersect 35C and 5C IWB.

I am making a mistake somewhere but don't know where. Any ideas? The manufacturer's data can be found HERE. Please note: I am only considering data points till 43C.

Performance curve

edit retag flag offensive close merge delete

Comments

Hi Waseem - I'm not sure if I can help you on this one, but it looks like you forgot to attach the performance curve you referenced. It would also be helpful if you can post some of the data you are using to create the curve.

kwalkerman's avatar kwalkerman  ( 2015-07-06 10:13:24 -0500 )edit

Hi @kwalkerman: Sorry, I have edited my question with my performance curve and manufacturer data. Thanks

Waseem's avatar Waseem  ( 2015-07-06 10:20:33 -0500 )edit

In a very recent DesignBuilder webinar, it was stated that they will be posting a free Excel utility to generate E+ VRF curves. It appears to be available now for your reference/comparison. You have to register for free to be able to download it: here

keb's avatar keb  ( 2015-07-06 10:31:07 -0500 )edit

@Kent Beason: Thanks for this. I think in DesignBuilder, they have implemented the same procedure that I used, which can be found HERE.

Waseem's avatar Waseem  ( 2015-07-06 10:47:04 -0500 )edit

2 Answers

Sort by ยป oldest newest most voted
8

answered 2015-07-23 17:59:27 -0500

updated 2015-07-23 22:59:52 -0500

For the boundary curve, you should predict ODB given IWB, as I show in the spreadsheet. To plot these points on the same graph as CapFT vs ODB, you need to convert the IWB used to regress the boundary curve to a CapFT value at the intersection of the low and high curves. This is simple since the low curves are flat vs ODB for each IWB. So for each IWB, swap out the low CapFT value and then plot the boundary curve using the "IWB converted to CapFT" vs ODB (or CAPFTiwb vs ODB).

Don't forget you can use table objects to describe performance.

http://www.fsec.ucf.edu/en/publicatio... If anyone is interested in doing this, Figure 6 shows how and you would only need the one table and NOT need the boundary curve or the high ODB curve (if I remember correctly).

image description

edit flag offensive delete link more

Comments

@rraustad: Thanks. I will have a go at this and will update.

Waseem's avatar Waseem  ( 2015-07-24 05:39:49 -0500 )edit
5

answered 2015-07-24 04:58:44 -0500

Jim Dirkes's avatar

updated 2015-07-24 05:04:44 -0500

Waseem, I missed this post originally, but have been making VRF performance curves in a similar manner to you. It' s not clear if your problem has been resolved, so I'll add a couple of thoughts. I have good agreement for my boundary curves when using either quadratic or cubic curves (but cubic seems slightly better). The only way that I can imagine for your boundary curve to vary so greatly from the actual data, which has a distinct and simple shape, is that you have calculated the curve using some incorrect values. As Richard says, the boundary curve data values should be Toa for each WB, in your case only 10 data pairs. This is the chart Richard showed. Did you find the problem? p.s., The chart below shows a composite view of low and high cooling capacity with the boundary condition incorporated. Solid lines are actual data; dashed lines are the curve-predicted values. p.p.s., High quality modeling requires the attention to detail that you have shown by checking the curve's actual performance Good work! image description

edit flag offensive delete link more

Comments

@Jim Dirkes and @rraustad: Thanks for your input. I will have a go by considering your suggestion and will update here.

Waseem's avatar Waseem  ( 2015-07-24 05:39:22 -0500 )edit

@Waseem were you able to get the extrapolation. I intend to do something similar, however, I do have manufacturers curves. But want to use experimental data and compare with existing EP models. Any thoughts from your end. I know the measured data is not standard conditions, but if I can generate a real performance curve it will help me. I have not yet started this work so would like to reduce my learning curve from your experience.

rkbest's avatar rkbest  ( 2015-07-24 17:15:16 -0500 )edit

Your Answer

Please start posting anonymously - your entry will be published after you log in or create a new account.

Add Answer

Careers

Question Tools

6 followers

Stats

Asked: 2015-07-06 09:56:33 -0500

Seen: 806 times

Last updated: Jul 24 '15