

I have been trying to create performance curve for a VRF system. I have followed Richard's paper to create them. I am misunderstanding the way extrapolation is done. The way I extrapolated is;
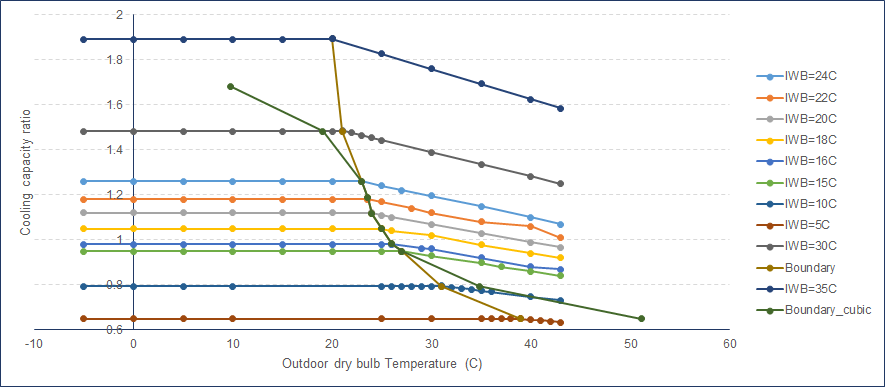
1) Use Cooling capacity ration function for Low and high temperatures to predict CAPFT (predicted) for all temperature range (e.g. -5C to -43C) for both these curves.
2) Finding the intersection of these curves (or very close points) and taking that ODB (outdoor dry-bulb) as a boundary curve point for a particular indoor wet-bulb temperature. However, by doing this I don't have any discontinuity (as points do tend to nearly overlap/intersect).
3) In order to plot boundary curve, I used cooling capacity ratio boundary curve to predicted ODB for each extrapolated IWB e.g. 5C, 10C IWB etc. Then, I used that predicted temperature to calculate predicted CAPFT. Please see attached performance curve for cooling. The cubic curve does not even touch/intersect 35C and 5C IWB.
I am making a mistake somewhere but don't know where. Any ideas?


