Question-and-Answer Resource for the Building Energy Modeling Community
First time here? Check out the Help page!
| | 1 | initial version |
Waseem,
I missed this post originally, but have been making VRF performance curves in a similar manner to you. It' s not clear if your problem has been resolved, so I'll add a couple of thoughts.
I have good agreement for my boundary curves when using either quadratic or cubic curves (but cubic seems slightly better). The only way that I can imagine for your boundary curve to vary so greatly from the actual data, which has a distinct and simple shape, is that you have calculated the curve using some incorrect values. As Richard says, the boundary curve data values should be Toa for each WB, in your case only 10 data pairs. This is the chart Richard showed.
Did you find the problem?
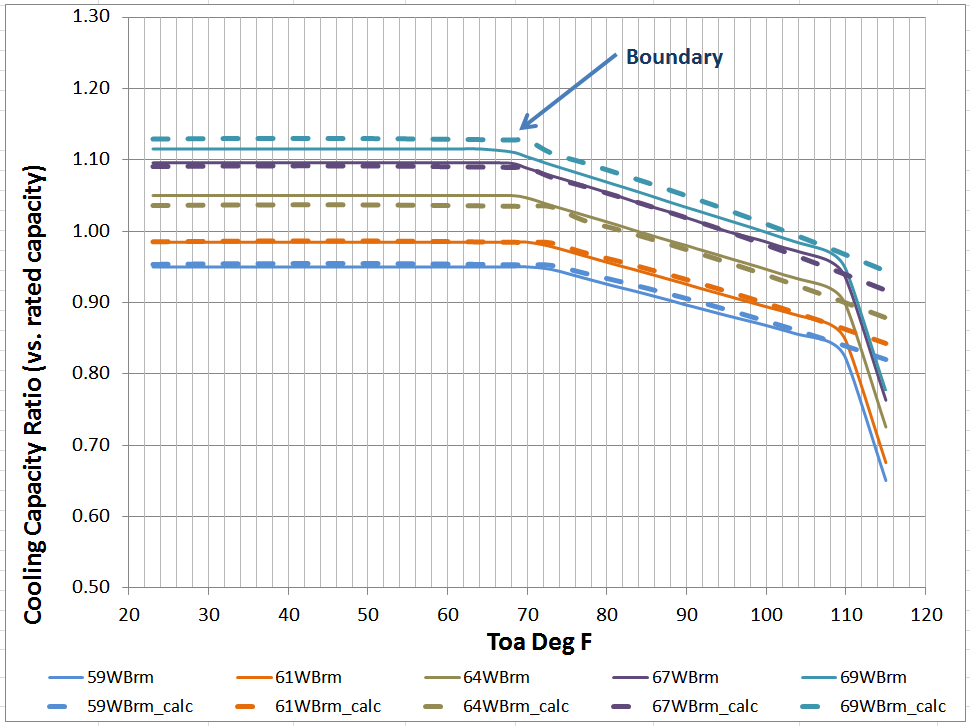
p.s., The chart below shows a composite view of low and high cooling capacity with the boundary condition incorporated. Solid lines are actual data; dashed lines are the curve-predicted values.
| | 2 | No.2 Revision |
Waseem,
I missed this post originally, but have been making VRF performance curves in a similar manner to you. It' s not clear if your problem has been resolved, so I'll add a couple of thoughts.
I have good agreement for my boundary curves when using either quadratic or cubic curves (but cubic seems slightly better). The only way that I can imagine for your boundary curve to vary so greatly from the actual data, which has a distinct and simple shape, is that you have calculated the curve using some incorrect values. As Richard says, the boundary curve data values should be Toa for each WB, in your case only 10 data pairs. This is the chart Richard showed.
Did you find the problem?
p.s., The chart below shows a composite view of low and high cooling capacity with the boundary condition incorporated. Solid lines are actual data; dashed lines are the curve-predicted values.
p.p.s., High quality modeling requires the attention to detail that you have shown by checking the curve's actual performance Good work!

