extrapolating performance curves for VRF systems
I have been trying to create performance curve for a VRF system. I have followed Richard's paper to create them. I am misunderstanding the way extrapolation is done. The way I extrapolated is;
1) Use Cooling capacity ration function for Low and high temperatures to predict CAPFT (predicted) for all temperature range (e.g. -5C to -43C) for both these curves.
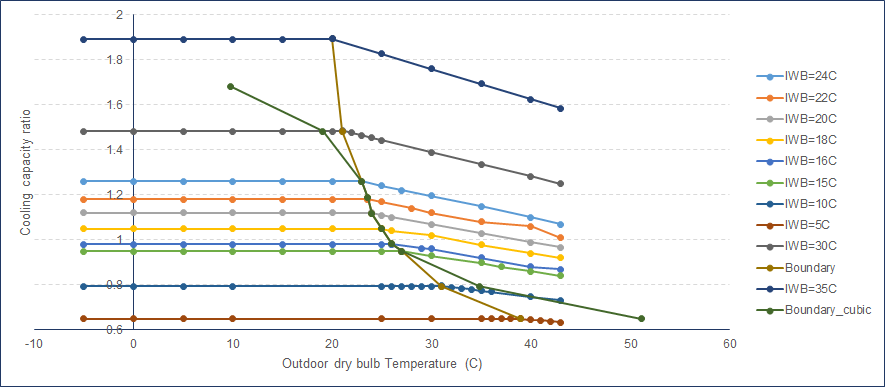
2) Finding the intersection of these curves (or very close points) and taking that ODB (outdoor dry-bulb) as a boundary curve point for a particular indoor wet-bulb temperature. However, by doing this I don't have any discontinuity (as points do tend to nearly overlap/intersect).
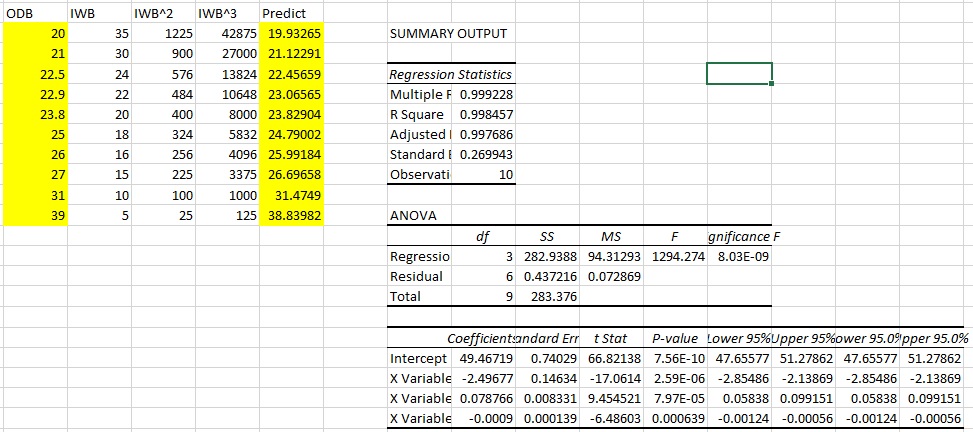
3) In order to plot boundary curve, I used cooling capacity ratio boundary curve to predicted ODB for each extrapolated IWB e.g. 5C, 10C IWB etc. Then, I used that predicted temperature to calculate predicted CAPFT. Please see attached performance curve for cooling. The cubic curve does not even touch/intersect 35C and 5C IWB.
I am making a mistake somewhere but don't know where. Any ideas? The manufacturer's data can be found HERE. Please note: I am only considering data points till 43C.


Hi Waseem - I'm not sure if I can help you on this one, but it looks like you forgot to attach the performance curve you referenced. It would also be helpful if you can post some of the data you are using to create the curve.
Hi @kwalkerman: Sorry, I have edited my question with my performance curve and manufacturer data. Thanks
In a very recent DesignBuilder webinar, it was stated that they will be posting a free Excel utility to generate E+ VRF curves. It appears to be available now for your reference/comparison. You have to register for free to be able to download it: here
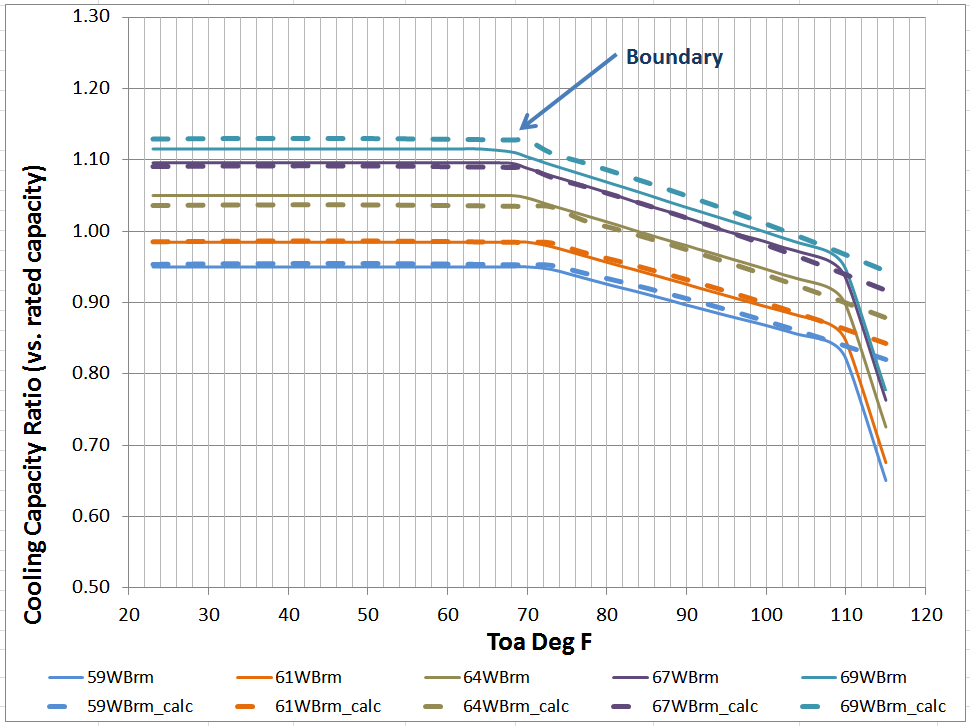
@Kent Beason: Thanks for this. I think in DesignBuilder, they have implemented the same procedure that I used, which can be found HERE.