Simulating C02 Concentration in energy plus
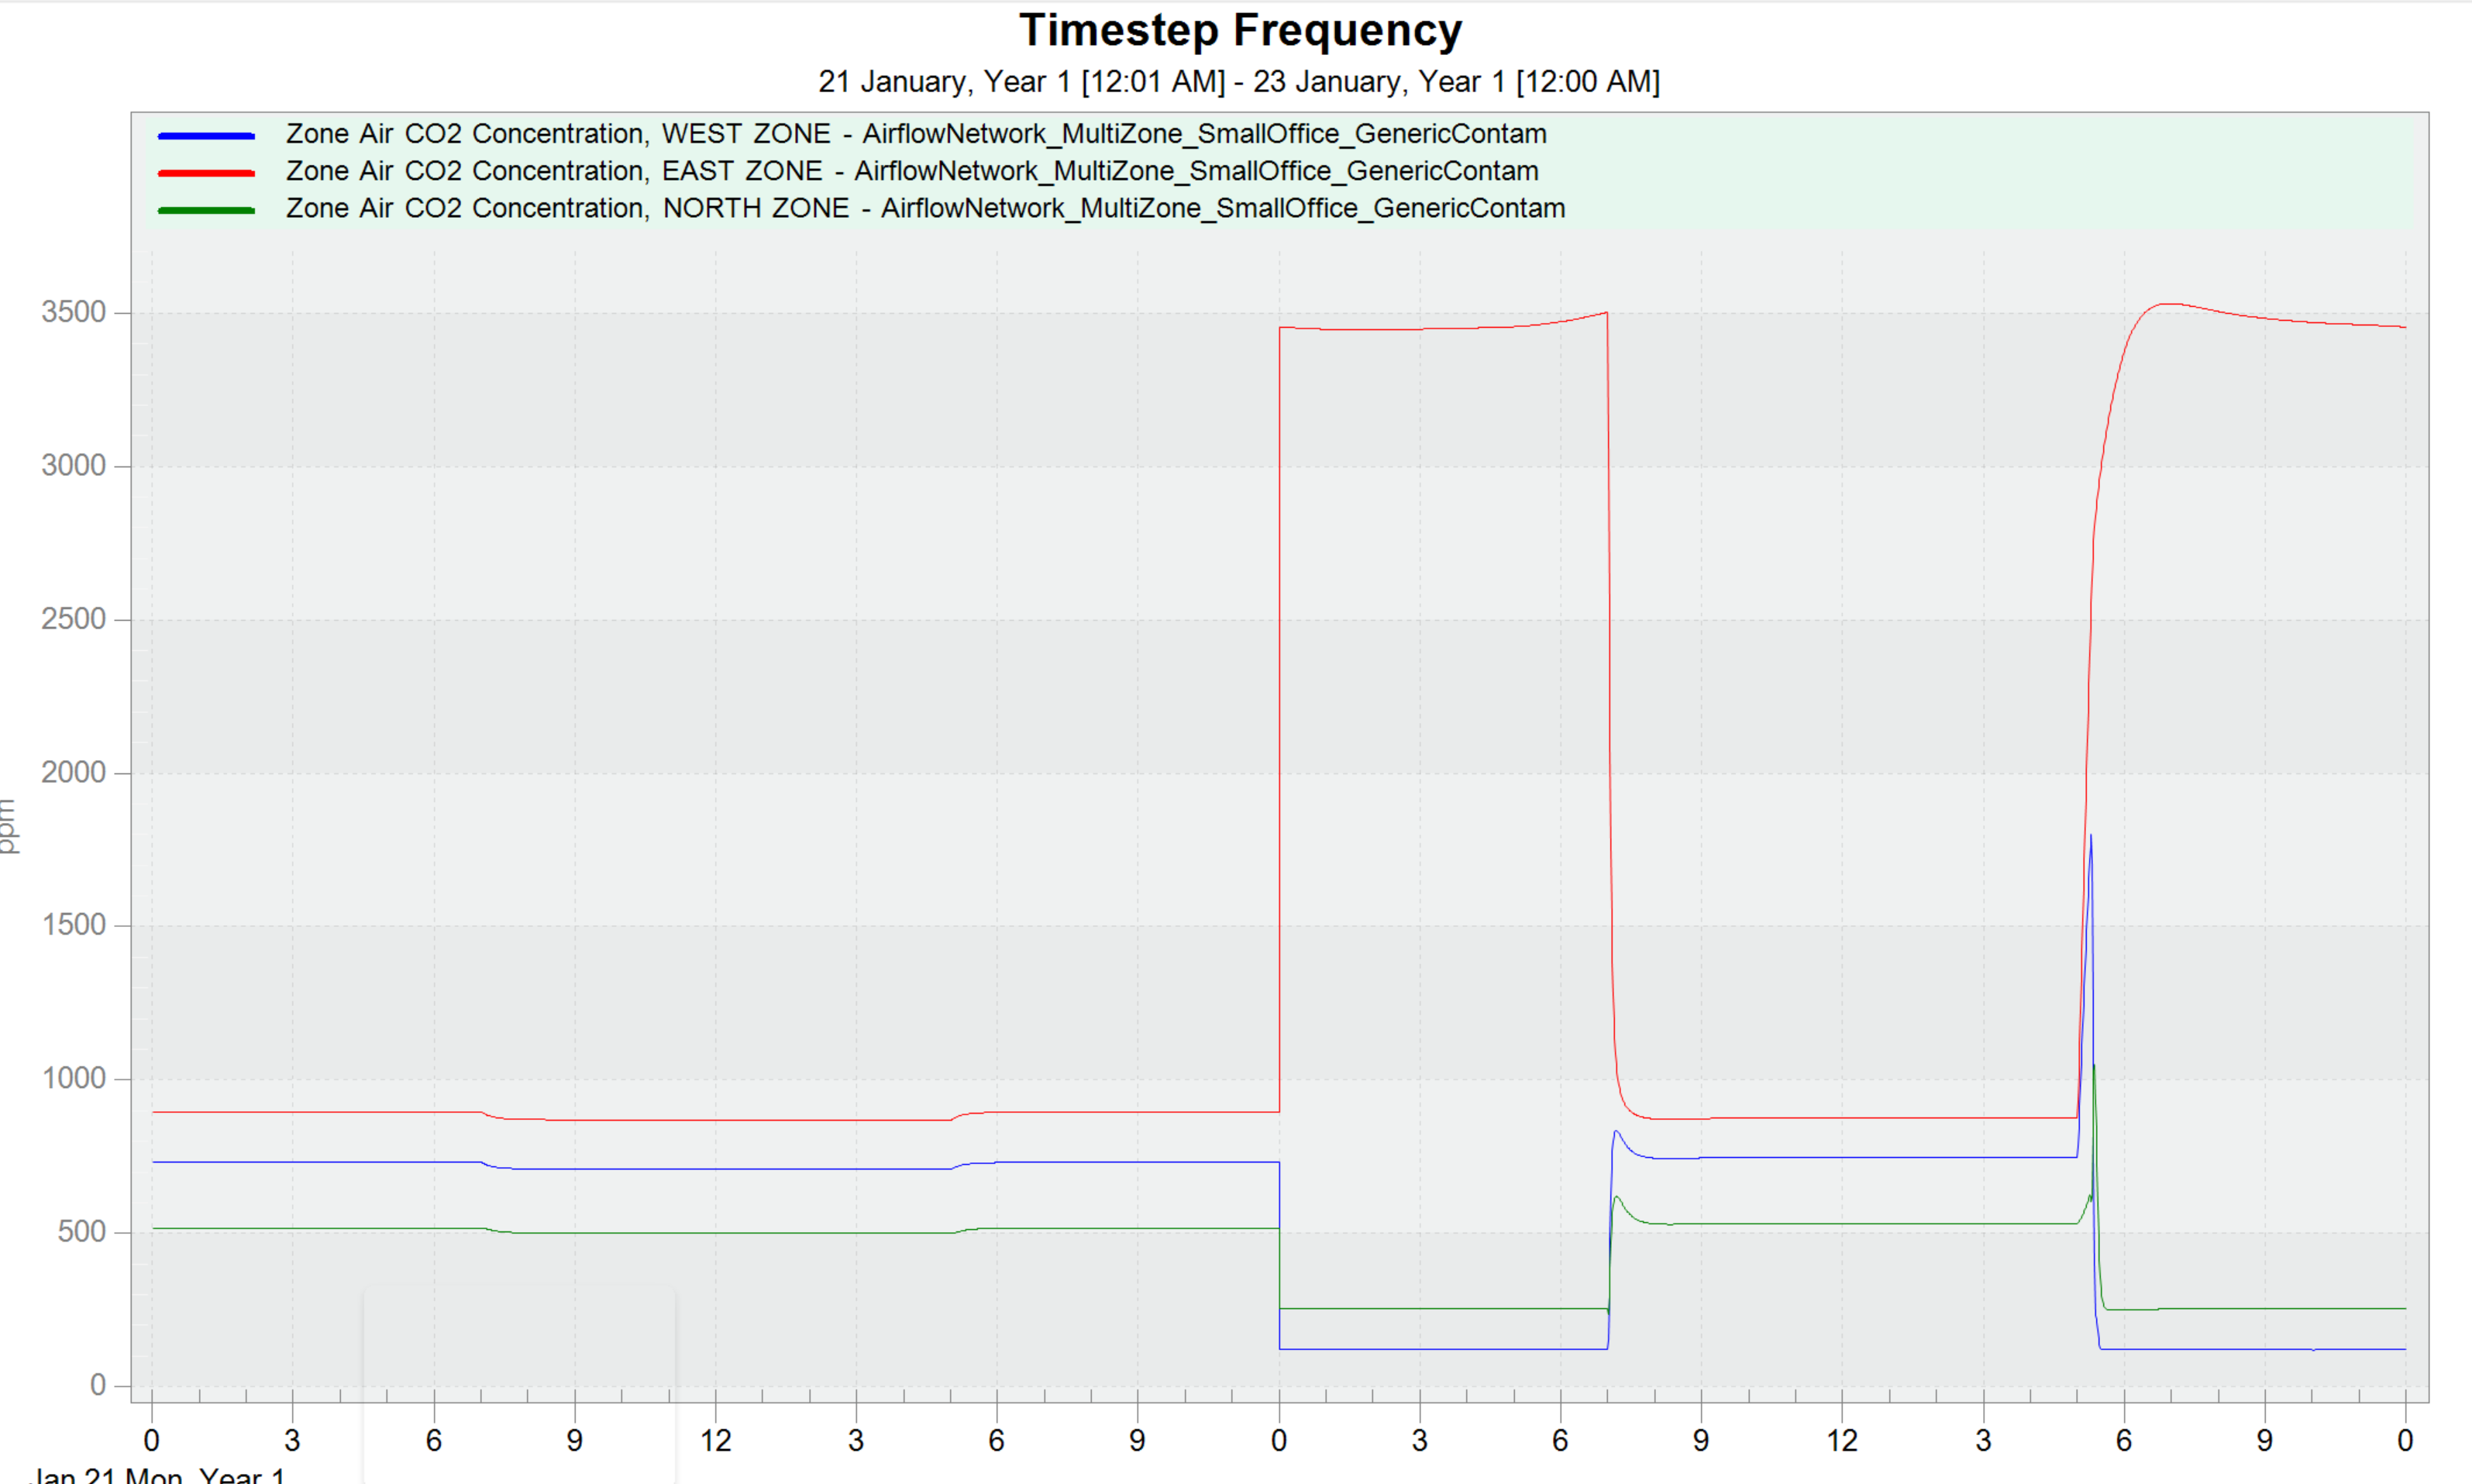
Hello all, I am trying to simulate the Co2 Concentration in a multizone airflow network in different zones of the building. After trying to modify the IDF file to my needs, I get a plot that I feel is kind of weird because of the sudden increase and decrease in Co2 concentrations at certain intervals. Could they be a possible explanation for the result of my simulation?C:\fakepath\Screenshot 2022-01-28 064458.png-This is the link to the simulation result
link text-This is the link to the IDF file.
Again, if I want to simulate Co2 concentration in the different zones based on changing occupancy(number of people in the zones). Is there a way to implement this without having to change the number of people in each zone manually? For clarity, I want to run a one-time simulation that shows the level of Co2 concentration in each zone based on varying number of occupants.
Please, I am a newbie working with energy plus.


