Question-and-Answer Resource for the Building Energy Modeling Community
Get started with the Help page
Ask Your Question
2

Simulating C02 Concentration in energy plus

asked 2022-01-28 06:42:19 -0500

Kaycee_fresh's avatar

updated 2022-02-08 09:14:31 -0500

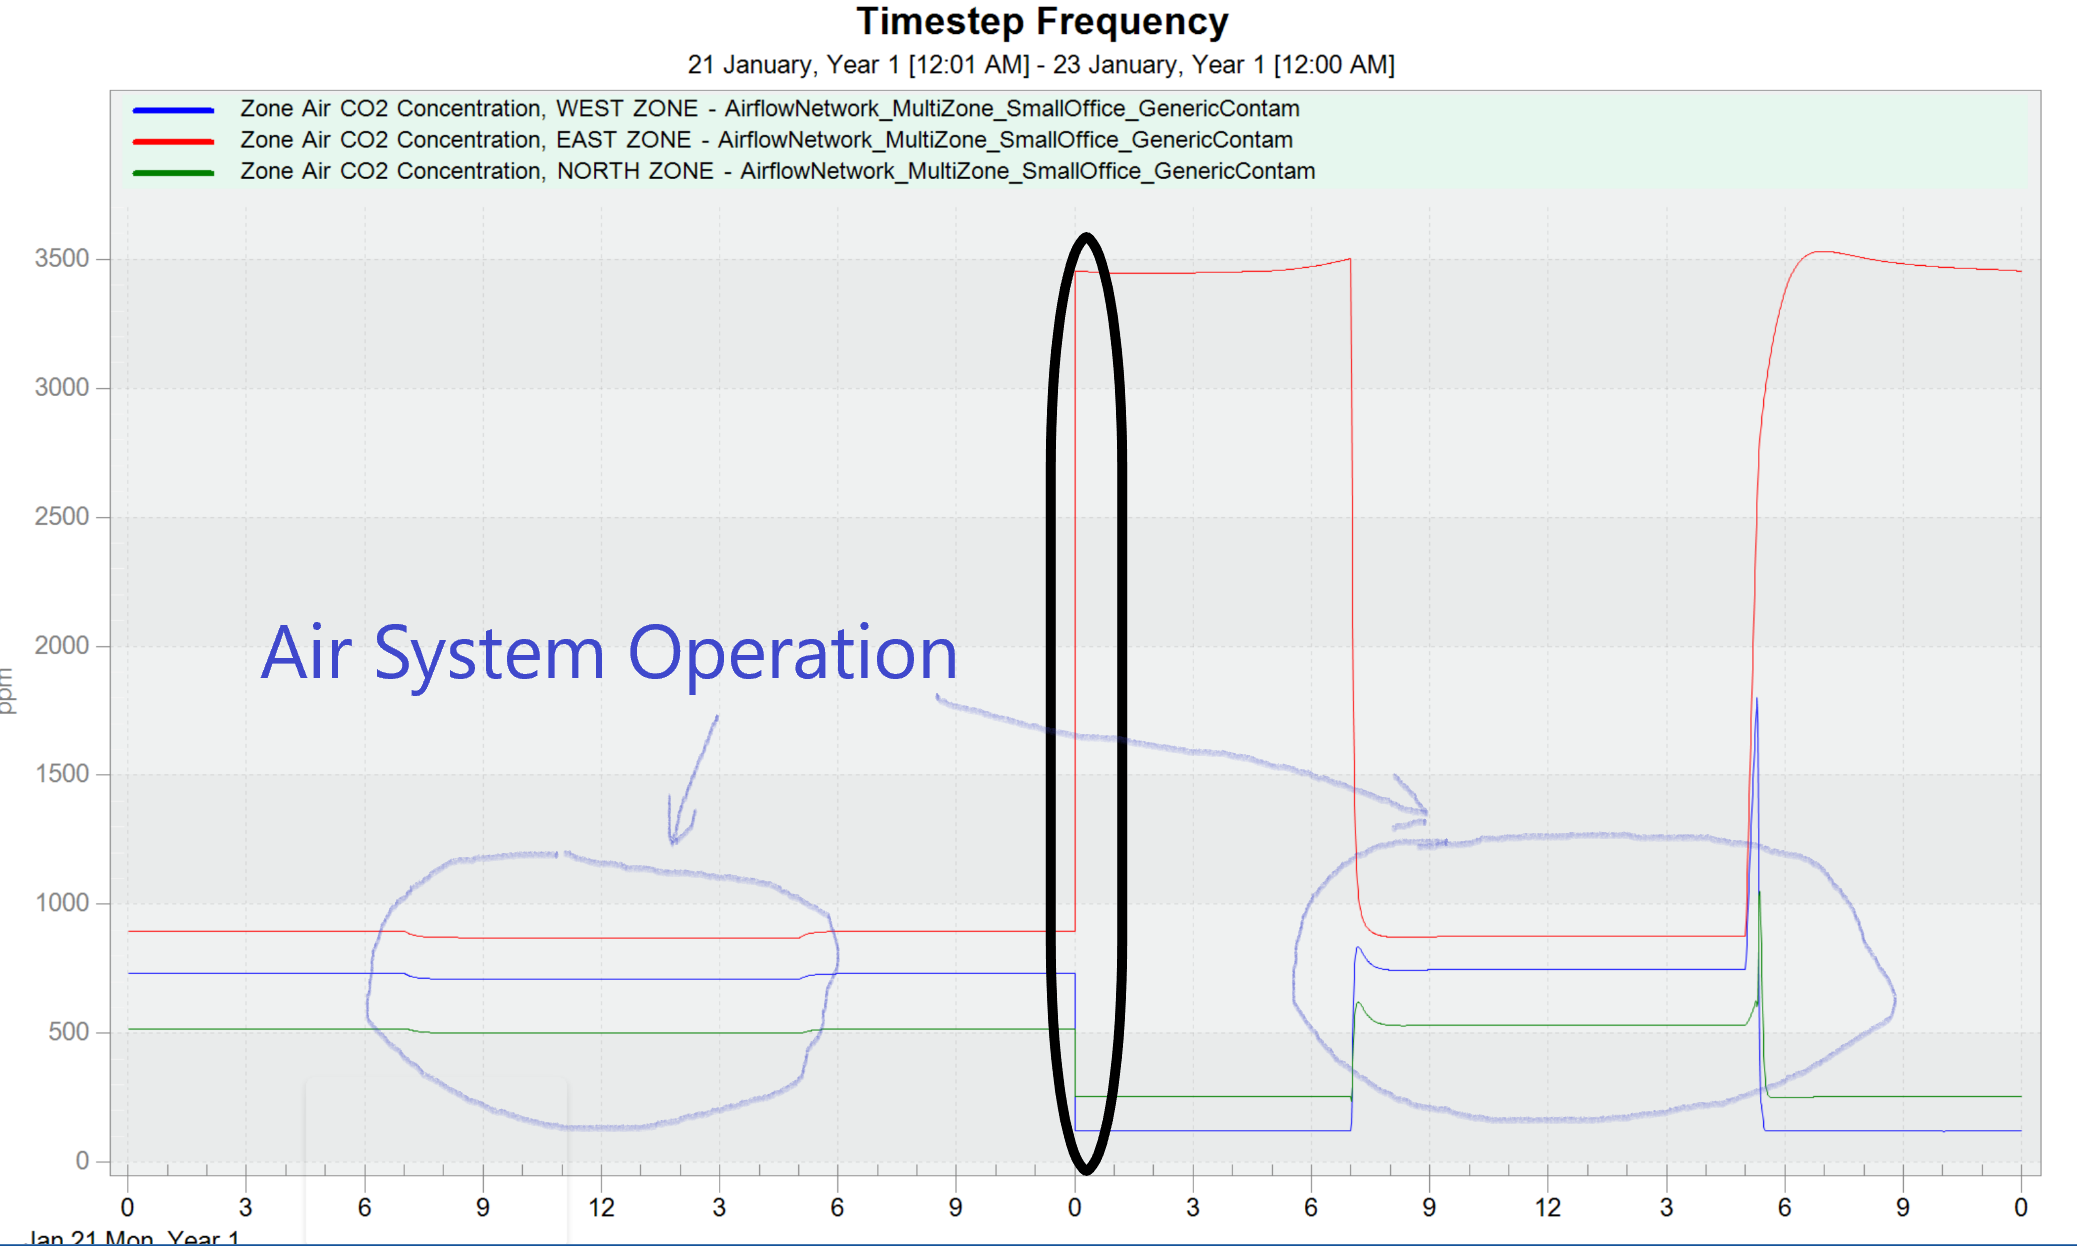
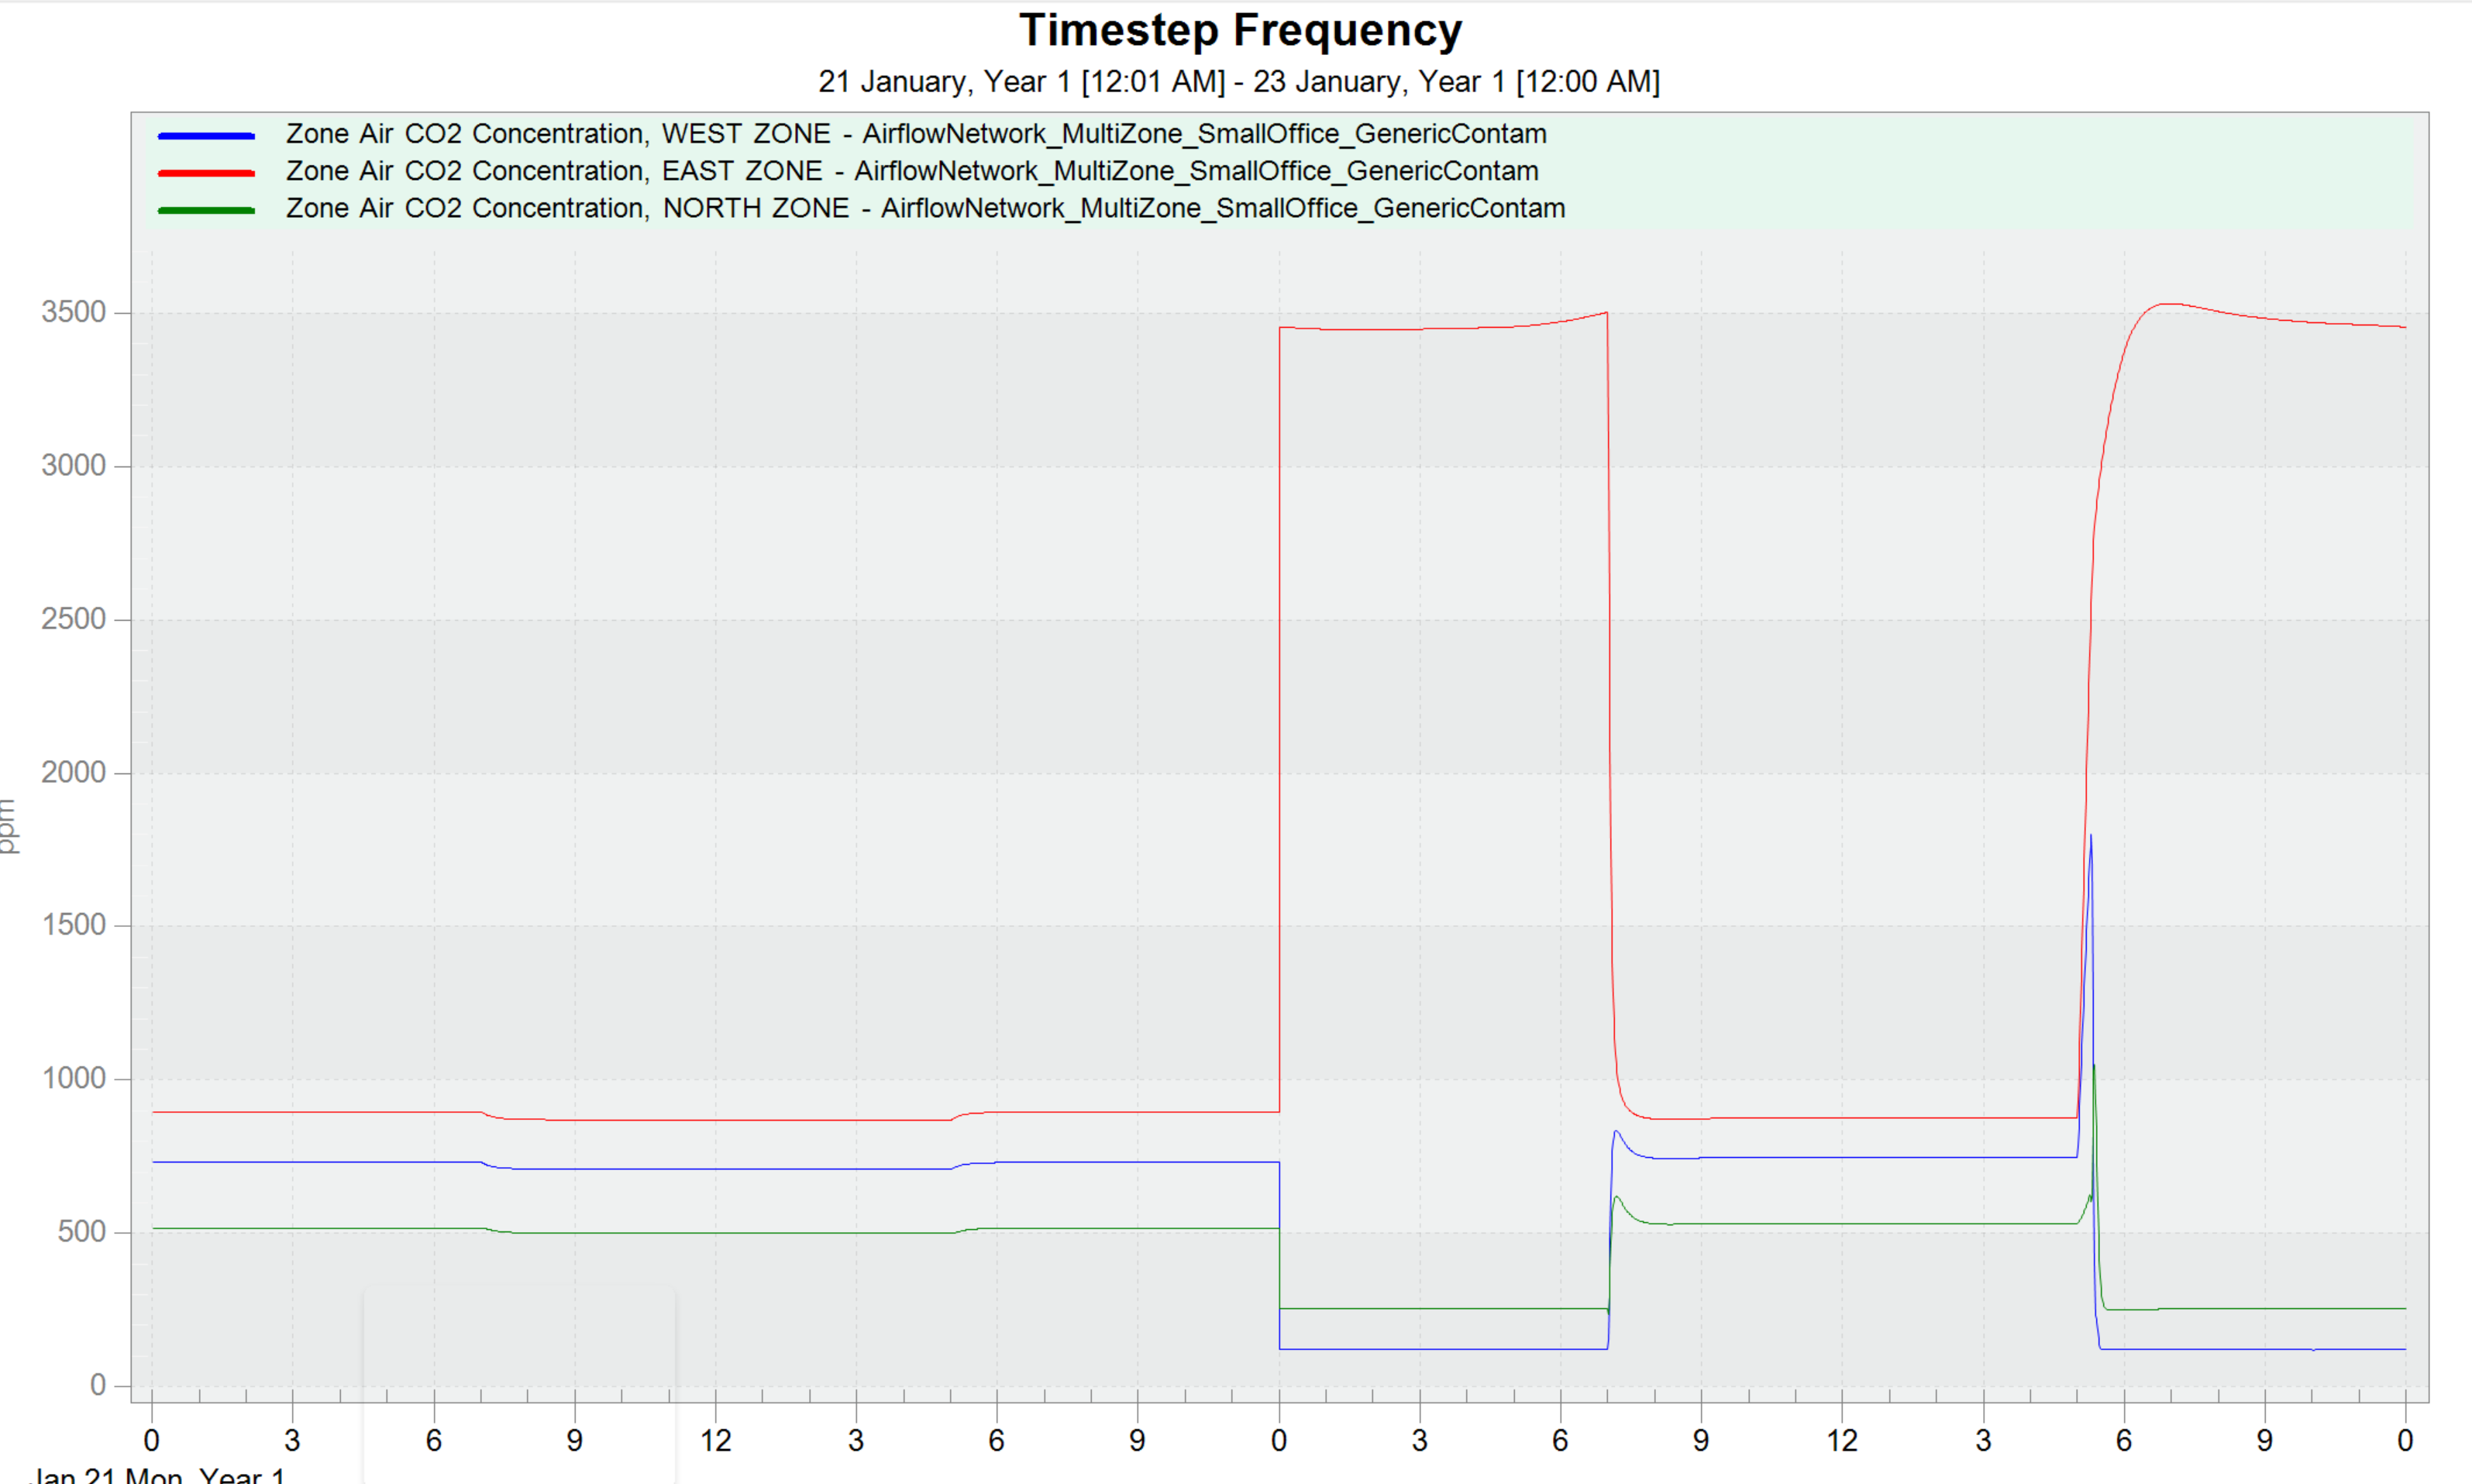
Hello all, I am trying to simulate the Co2 Concentration in a multizone airflow network in different zones of the building. After trying to modify the IDF file to my needs, I get a plot that I feel is kind of weird because of the sudden increase and decrease in Co2 concentrations at certain intervals. Could they be a possible explanation for the result of my simulation?C:\fakepath\Screenshot 2022-01-28 064458.png-This is the link to the simulation result link text-This is the link to the IDF file.

Again, if I want to simulate Co2 concentration in the different zones based on changing occupancy(number of people in the zones). Is there a way to implement this without having to change the number of people in each zone manually? For clarity, I want to run a one-time simulation that shows the level of Co2 concentration in each zone based on varying number of occupants.

Please, I am a newbie working with energy plus.

edit retag flag offensive close merge delete

Comments

@Kaycee_fresh can you add an image to your post, and/or provide a link to your IDF and/or output files? That will help other users find a solution.

Aaron Boranian's avatar Aaron Boranian  ( 2022-01-28 09:47:50 -0500 )edit

Hi Aaron, please see attached the necessary link to my simulation result.@Aaron Boranian

Kaycee_fresh's avatar Kaycee_fresh  ( 2022-01-30 03:49:05 -0500 )edit

@Kaycee_fresh the Google Drive link is private, I think you need to change access or sharing settings so that anyone with the link can see the IDF.

Aaron Boranian's avatar Aaron Boranian  ( 2022-01-31 15:12:12 -0500 )edit

1 Answer

Sort by ยป oldest newest most voted
3

answered 2022-01-31 11:25:29 -0500

You only have 2 days of output data, starting on Jan 21. My guess is that you are you only simulating design days and not an annual simulation, set through the SimulationControl object with:

  • Run Simulation for Sizing Periods input field set to "Yes"
  • Run Simulation for Weather File Run Periods input field set to "No"

In that case, if you have defined a winter and summer design day in the IDF, the end of Jan 21 (winter design day) jumps straight into the beginning of the summer design day (July 21, e.g.). That explains the sudden change in output values in the middle of your plot (black circle in image below). The changes from 7 AM - 5 PM on each day of your plot is likely because of the air system operating, delivering supply air with a different CO2 level than the zone air. For the East Zone (red line), it looks like the supply air has less CO2 than the zone since it reduces from 3500 ppm to ~800 ppm. It is the opposite case for the other two zones (they increase CO2 during operation hours).

See a marked up image of your plot below to help explain.

image description

edit flag offensive delete link more

Comments

Thank you very much @aaron for your input

Kaycee_fresh's avatar Kaycee_fresh  ( 2022-02-13 01:36:34 -0500 )edit

Your Answer

Please start posting anonymously - your entry will be published after you log in or create a new account.

Add Answer

Training Workshops

Careers

Question Tools

2 followers

Stats

Asked: 2022-01-28 06:42:19 -0500

Seen: 301 times

Last updated: Feb 23 '22