
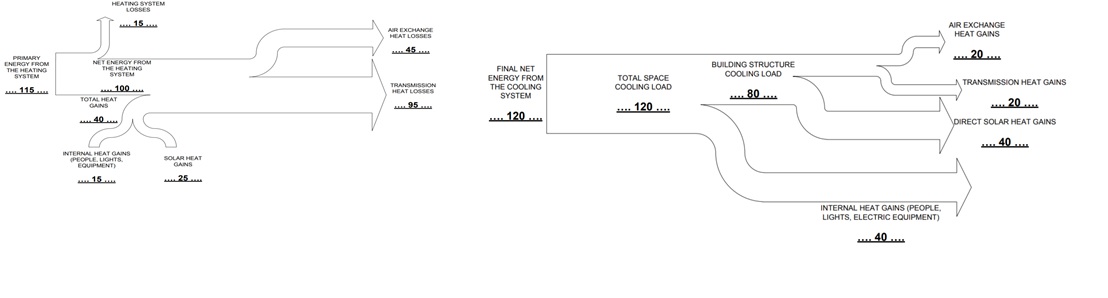
Hello; dear Designbuilder users, I have to translate my DB results in terms of those two diagrams, and I am struggling to do that, for the first one it is clear the primary energy and the heat gains are easily found on the results file, but the rest of them, I do not know which output would represent what. Similar problem for the second one
I have a base case and a series of retrofits, and I have to present all the results in terms of these diagrams, can anyone give me a hand with identifying the best result to represent those variables, thanks a lot


