Question-and-Answer Resource for the Building Energy Modeling Community
Get started with the Help page
Ask Your Question
2

Why can the interpolated Timestep demand be greater than the Hourly demand?

asked 2023-03-30 04:59:26 -0500

Keigo's avatar

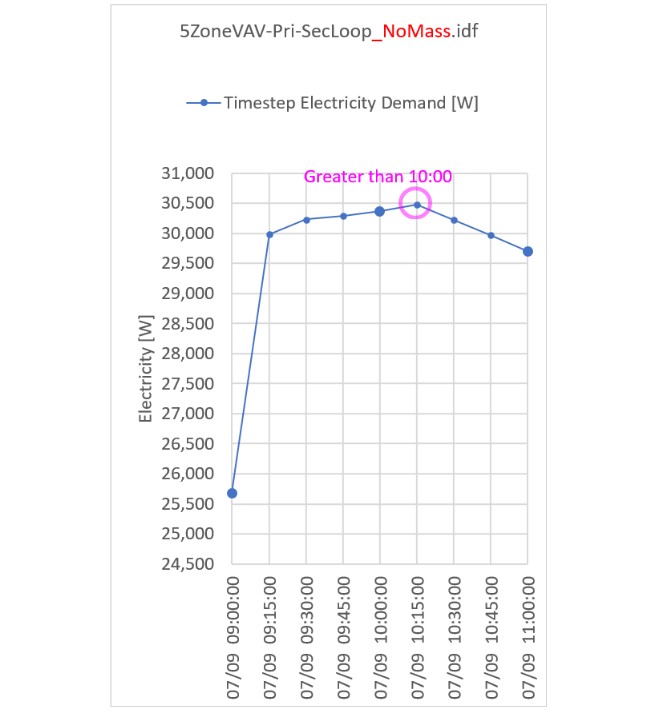
Any ExampleFile is fine, but I just use 5ZoneVAV-Pri-SecLoop.idf to explain. Actually, I have two questions.

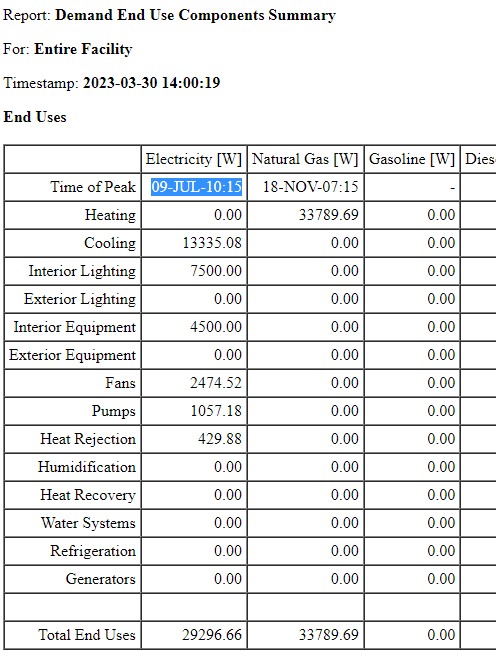
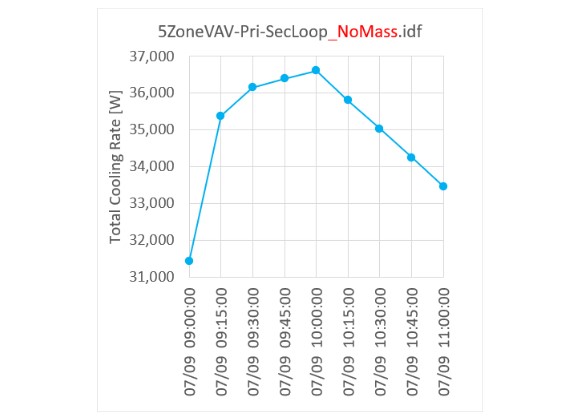
EnergyPlus reports Demand End Use Components Summary. Time of Peak is a specific timestep (9 July 10:15) rather than hour (9 July 10:00 or 11:00).

image description

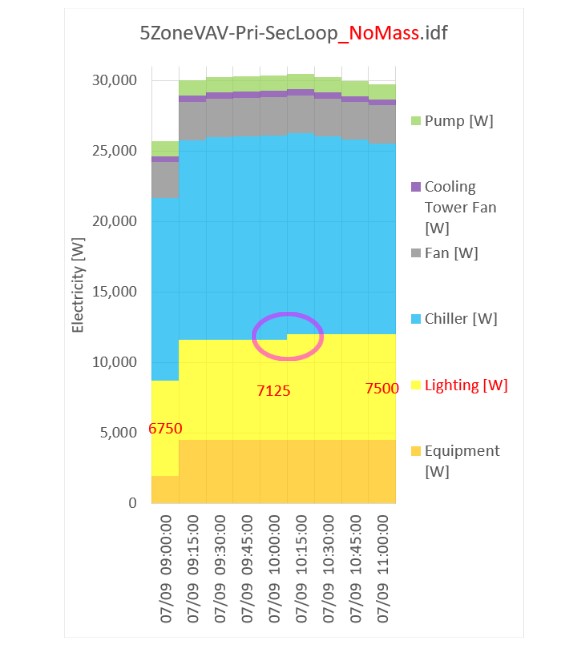
I have also output the following Output:Variable objects and manually calculate the total electricity demand for each Timestep throughout the year.

Output:Variable,*,Lights Electricity Rate ,Timestep;
Output:Variable,*,Electric Equipment Electricity Rate ,Timestep;
Output:Variable,*,Fan Electricity Rate ,Timestep;
Output:Variable,*,Chiller Electricity Rate ,Timestep;
Output:Variable,*,Pump Electricity Rate ,Timestep;
Output:Variable,*,Cooling Tower Fan Electricity Rate ,Timestep;
Output:Variable,*,Boiler NaturalGas Rate ,Timestep;

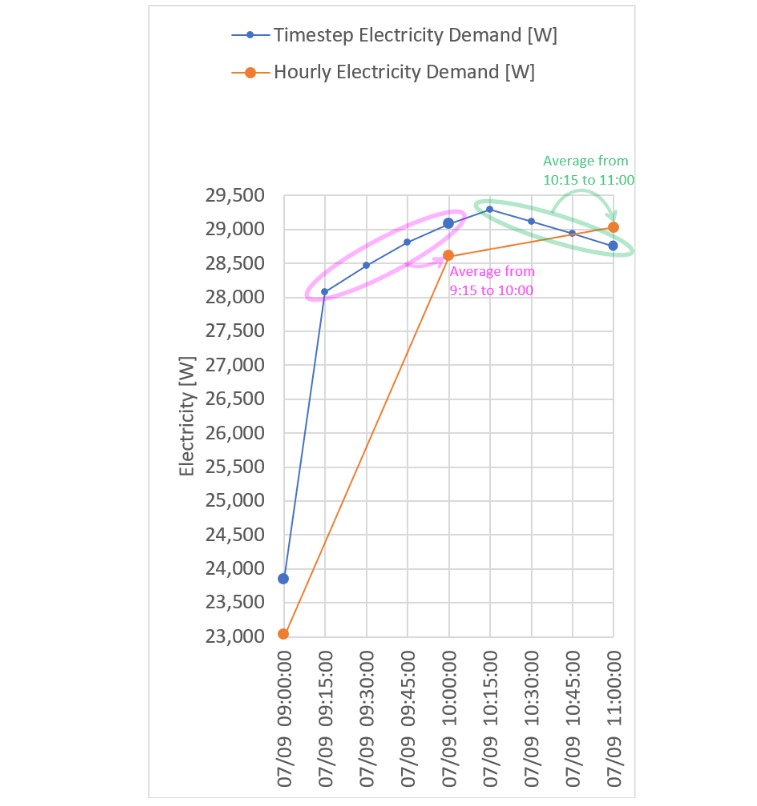
The chart below is an extract of total electricity demand from 9:00 to 11:00 on 9 July.

image description

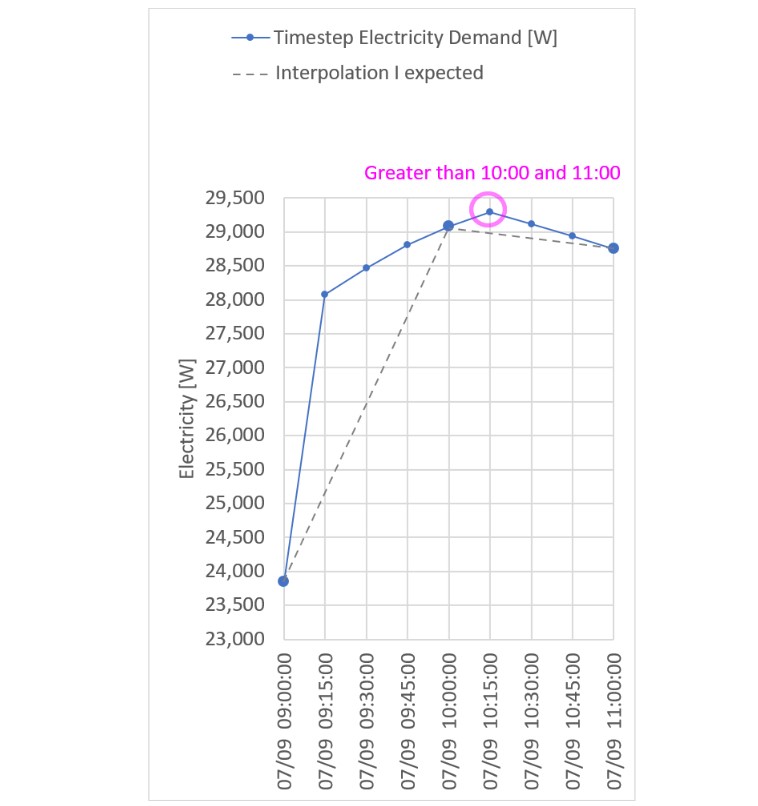
The dashed line is what I expected. I thought liniear interpolation is applied in EnergyPlus. If that's the case, I know that what is interpolated is such as weather condision and the demand is just a result, but still it's weird to me that the timestep value exceeds the hourly value.

Question 1: Does anyone know why the interpolated Timestep electricity demand can be greater than the Hourly electricity demand?


Besides, I changed Reporting Frequency of Output:Variable to Hourly. So, I got two results: the Timestep result and the Hourly result. I have not changed Timestep which is 4.

I compared the Timestep result and the Hourly result. They are different!

image description

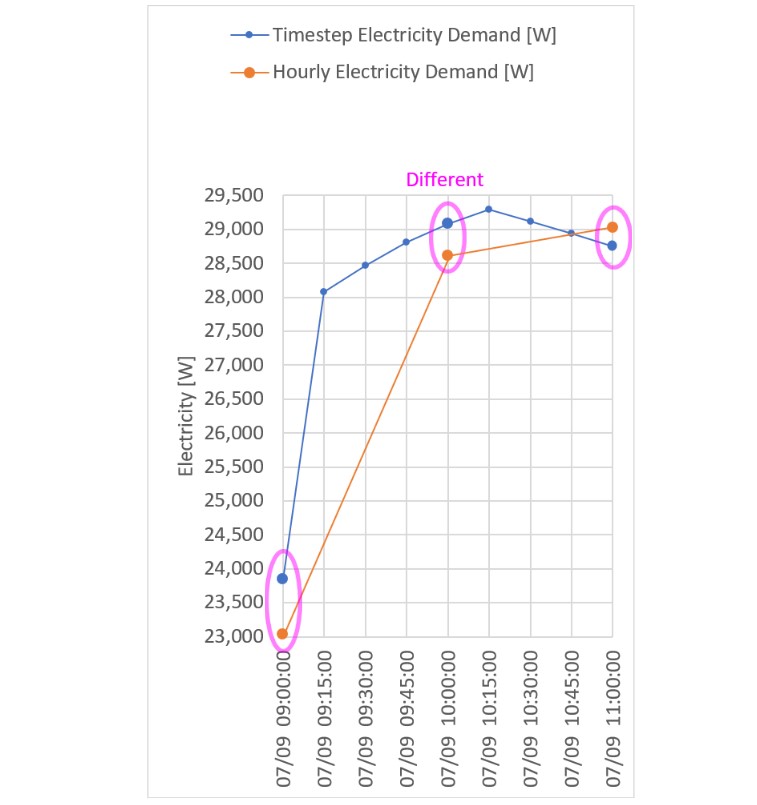
Question 2: Why are the simulation results for every hour different between the Timestep result and the Hourly result?

For this ExampleFile, the difference between the Timestep electricity demand and the Hourly electricity demand is not so large, but for my another model, the Timestep electricity demand is 13% greater than the Hourly electricity demand, which is a huge difference.

The idf files(V22-2-0) and the results are here.

Just answering one of my questions is appreciated.

edit retag flag offensive close merge delete

Comments

Q1: Thermal inertia is enough to explain the drift, IMHO. Suspect a sharp morning increase in AC/ventilation (i.e. solar + lighting + plug loads), possibly exacerbated by setpoint recovery. You can imagine some fraction of that load stored in construction layers, maybe taking an hour to dissipate. The IDFs don't hold requests to interpolate scheduled values - only weather variables would be interpolated in this case (as you mention).

Denis Bourgeois's avatar Denis Bourgeois  ( 2023-03-30 07:22:50 -0500 )edit

A suggestion would be to add 
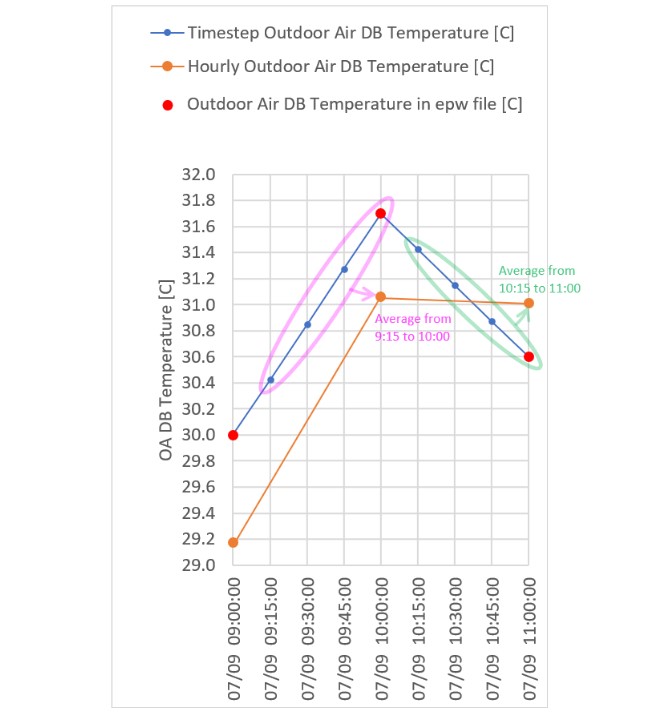
Output:Meter:MeterFileOnly,Electricity:Facility,hourly; (or ,timestep;) and compare the meter file data (*Meter.csv) to your results (use meter data in joules divided by seconds). Regarding the difference between timestep and hourly results, the data is averaged over the reporting frequency. You can see that clearly in your second plot by comparing the hourly data to the 09:15 - 10:00 and 10:15 - 11:00 time step average. I looked at the code and the reports for this table come directly from the meter. If this result shows an issue then we should look at that.

rraustad's avatar rraustad  ( 2023-03-30 08:22:39 -0500 )edit
1

The file you are running has 15 minute timesteps so it is completely feasible that the peak would be at a some point other than the hour. I'm not sure why you thought linear interpolation would be applying to the demand by end use table. That table uses the timestep values. Maybe I'm misunderstanding what the issue is.

JasonGlazer's avatar JasonGlazer  ( 2023-03-30 08:51:44 -0500 )edit

Thank you all for your comments. They are very helpful. I posted an answer.

Keigo's avatar Keigo  ( 2023-03-31 04:31:10 -0500 )edit

1 Answer

Sort by » oldest newest most voted
2

answered 2023-03-31 01:26:25 -0500

Keigo's avatar

updated 2023-03-31 04:25:04 -0500

For my Question 1, I tested another case in response to @Denis Bourgeois 's comment. I changed Construction objects so that all the walls, roofs, floors and ceilings consist of Material:NoMass. Besides, WindowMaterial:Glazing and Windowmaterial:Gas were replaced to WindowMaterial:SimpleGlazingSystem. I got the following warning in the err file, but this is what I intend to do.

   ** Warning ** This building has no thermal mass which can cause an unstable solution.

Below is the resuts of 5ZoneVAV-Pri-SecLoop_NoMass.idf. I thought the effect of delayed thermal response was removed, but the Timestep total electricity demand at 10:15 on 9 July is still higher than the demand at 10:00 on 9 July.

image description

Actually, the total cooling load is the largest at 10:00 on 9 July as shown below, which makes sense.

image description

Then, why is the total electricity demand at 10:15 larger than the total electricity demand at 10:00? The cause was simple. The lighting load was different. The chart below shows the breakdown of the total electricity demand. The lighting load of 7500W at 10:15 is larger than the lighting load of 7125W at 10:00. That's why the total electricity demand is the largest at 10:15 on 9 July.

image description

The lighting schedule of this ExampleFile is as follows. The fraction is 0.95 at 10:00 but 1.00 at 10:15. Schedules can be modelled to be interpolated, but they are not for this ExampleFile.

Schedule:Compact,
    LIGHTS-1,                !- Name
    Fraction,                !- Schedule Type Limits Name
    Through: 12/31,          !- Field 1
    For: WeekDays SummerDesignDay CustomDay1 CustomDay2,  !- Field 2
    Until: 8:00, 0.05,       !- Field 4
    Until: 9:00, 0.9,        !- Field 6
    Until: 10:00, 0.95,      !- Field 8
    Until: 11:00, 1.00,      !- Field 10
    Until: 12:00, 0.95,      !- Field 12
    Until: 13:00, 0.8,       !- Field 14
    Until: 14:00, 0.9,       !- Field 16
    Until: 18:00, 1.00,      !- Field 18
    Until: 19:00, 0.60,      !- Field 20
    Until: 21:00, 0.40,      !- Field 22
    Until: 24:00, 0.05,      !- Field 24
    For: Weekends WinterDesignDay Holiday,  !- Field 25
    Until: 24:00, 0.05;      !- Field 27

The conclusion is that the Timestep demand can be greater than the Hourly demand depending on the combination of various factors such as weather data and schedules of people, lighting, equipment, etc.


For my Question 2, @rraustad 's comment is the answer. The Hourly data at 10:00 is the average of Timestep data at 9:15, 9:30, 9:45 and 10:00. I'm ashamed to say I didn't know that.

enter code here

For reference, I also compared Hourly OA temperature, Timestep OA temperature and the original OA temperature in the epw file. Similarly, The Hourly OA temperature at 10:00 is the average of Timestep OA temperatures at 9:15, 9:30, 9:45 and 10:00. The Hourly OA temperatue is different from the original OA temperature in the epw file.

image description

edit flag offensive delete link more

Comments

Nice catch, Keigo!

Denis Bourgeois's avatar Denis Bourgeois  ( 2023-03-31 05:17:39 -0500 )edit

Your Answer

Please start posting anonymously - your entry will be published after you log in or create a new account.

Add Answer

Careers

Question Tools

1 follower

Stats

Asked: 2023-03-30 04:59:26 -0500

Seen: 67 times

Last updated: Mar 31 '23