Question-and-Answer Resource for the Building Energy Modeling Community
First time here? Check out the Help page!
| | 1 | initial version |
You only have 2 days of output data, starting on Jan 21. My guess is that you are you only simulating design days and not an annual simulation, set through the SimulationControl object with:
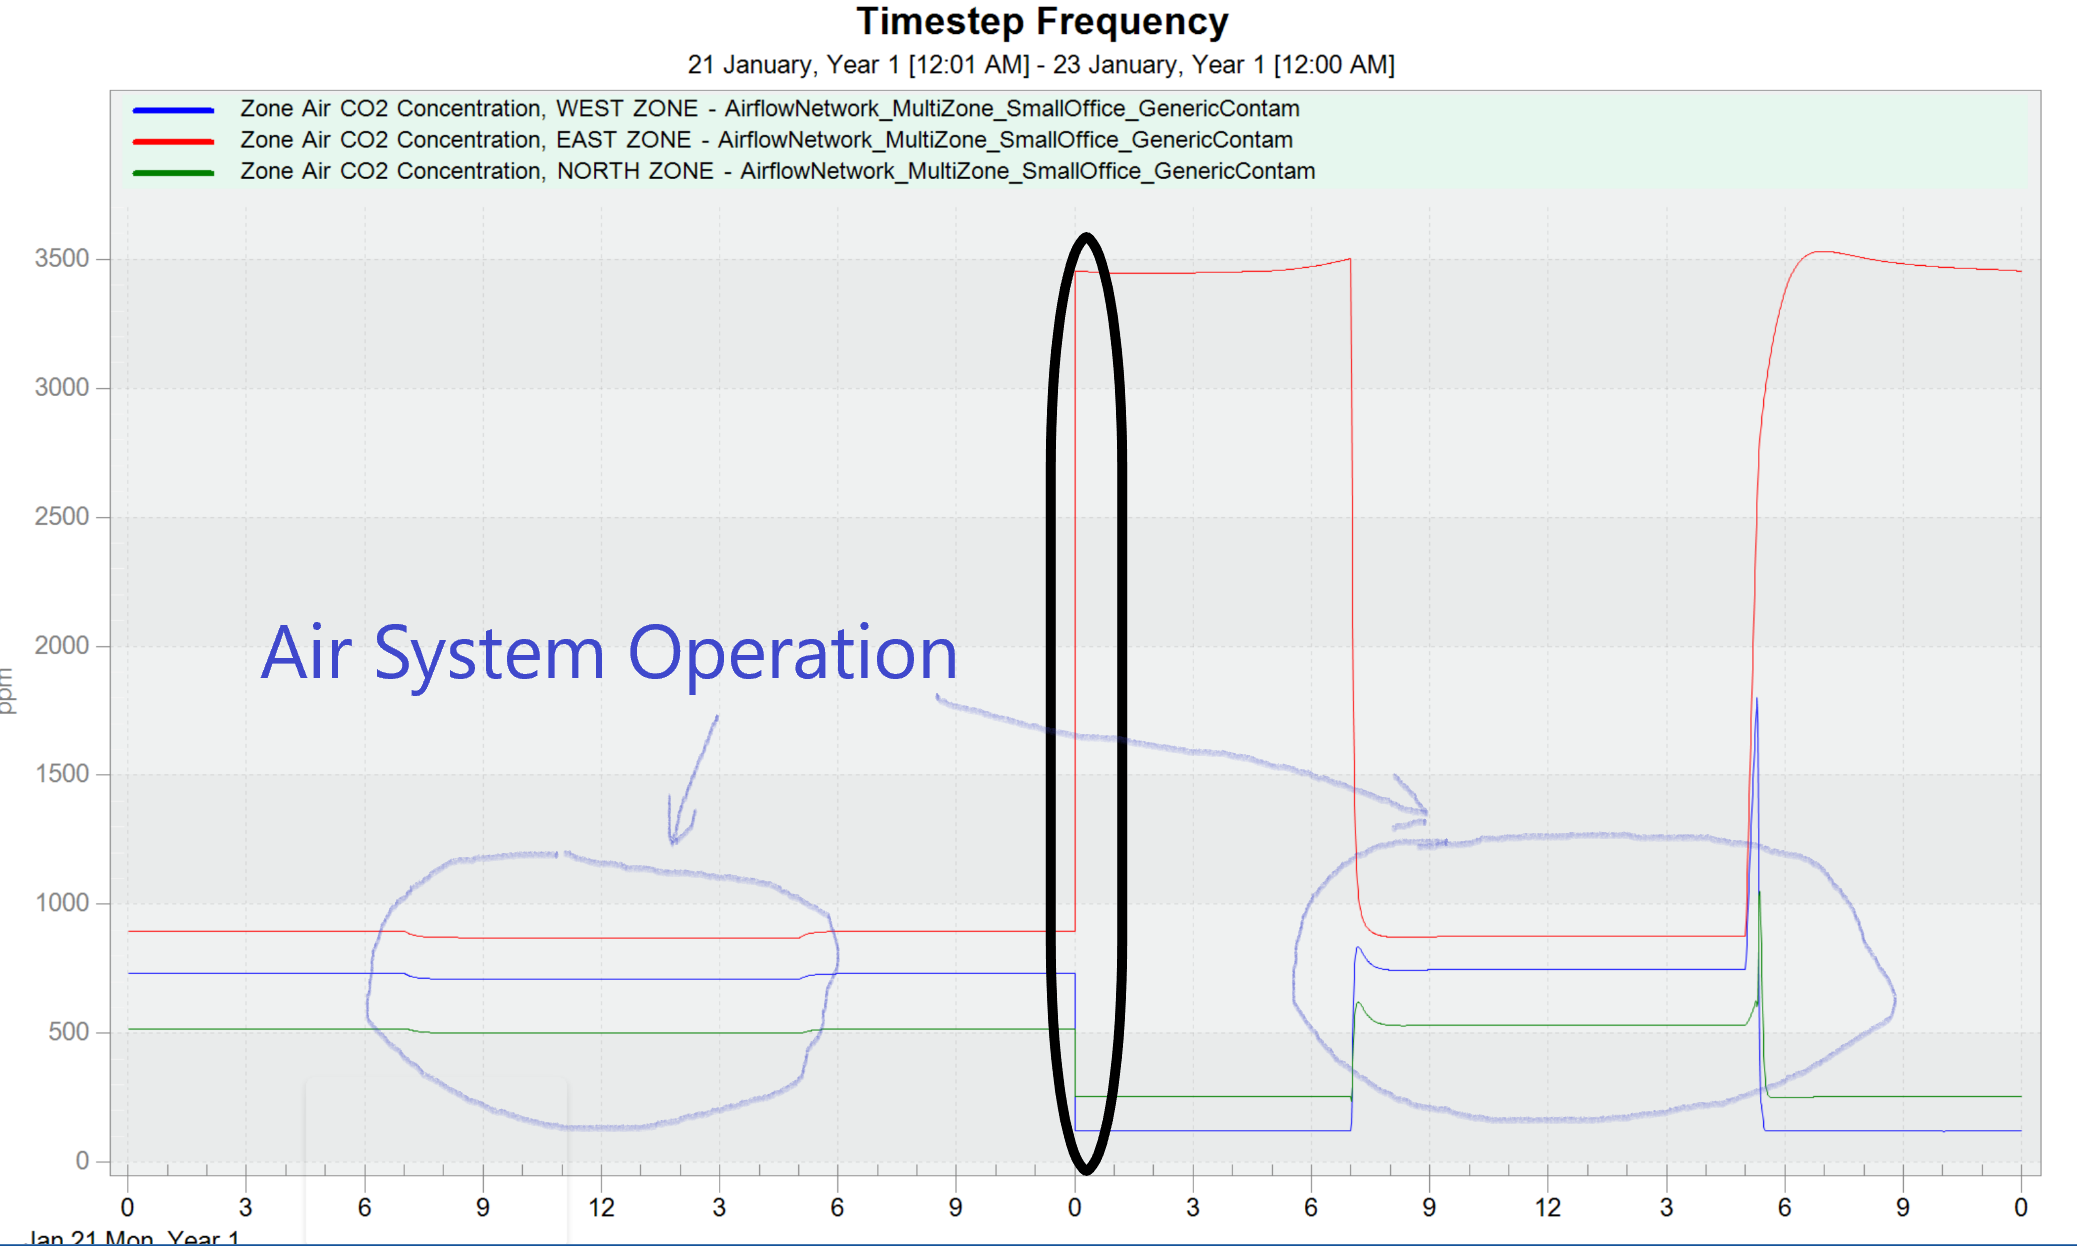
In that case, if you have defined a winter and summer design day in the IDF, the end of Jan 21 (winter design day) jumps straight into the beginning of the summer design day (July 21, e.g.). That explains the sudden change in output values in the middle of your plot (black circle in image below). The changes from 7 AM - 5 PM on each day of your plot is likely because of the air system operating, delivering supply air with a different CO2 level than the zone air. For the East Zone (red line), it looks like the supply air has less CO2 than the zone since it reduces from 3500 ppm to ~800 ppm. It is the opposite case for the other two zones (they increase CO2 during operation hours).
See a marked up image of your plot below to help explain.