Question-and-Answer Resource for the Building Energy Modeling Community
Get started with the Help page
Ask Your Question
2

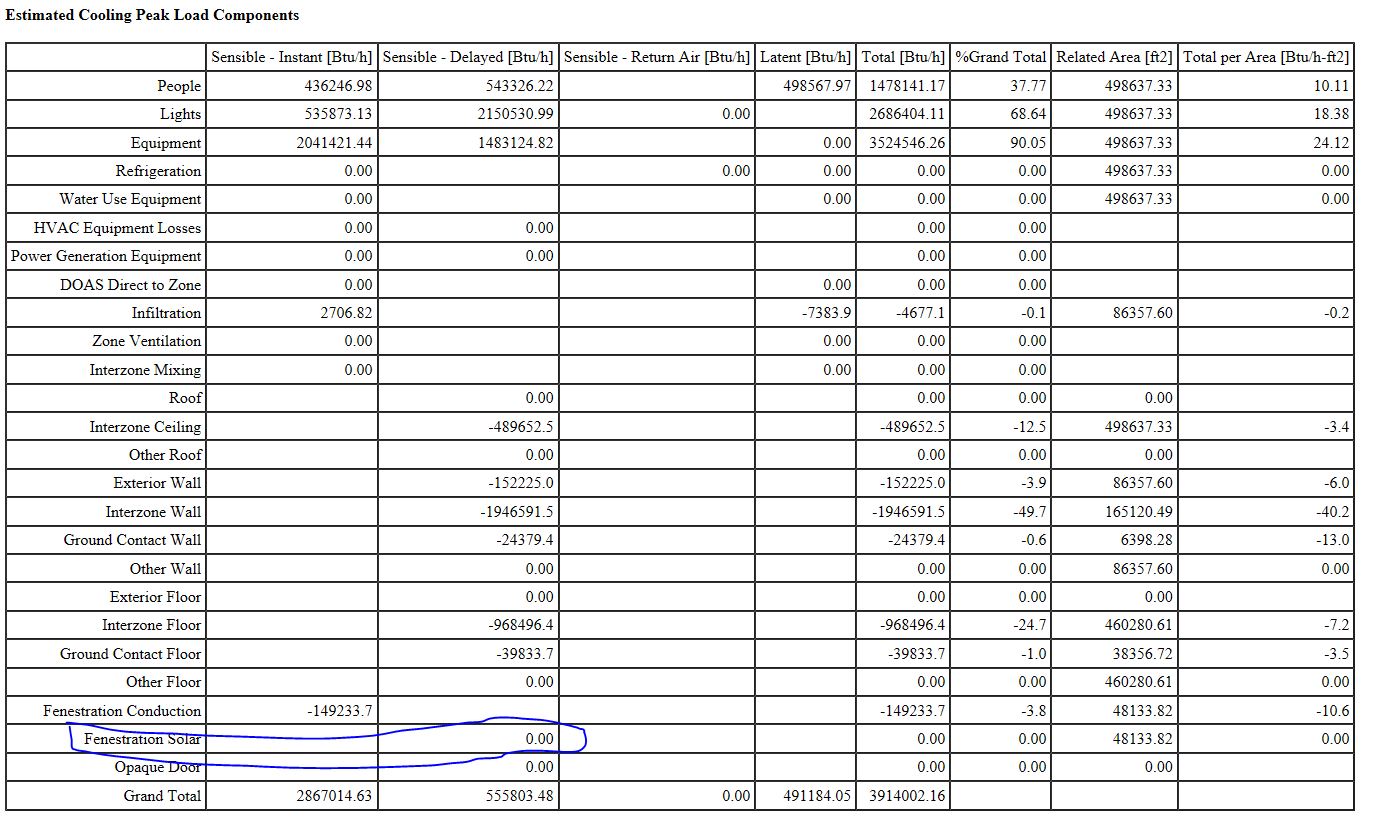
Fenestration Solar value 0

asked 2018-10-30 23:53:51 -0500

Ranjani's avatar

updated 2020-01-18 10:06:30 -0500

Hello everyone, I am using CBECC-Com 2016.3.0 SP1 version( http://bees.archenergy.com/resources....) Large office building and using LA as my weather file. I ran the cbecc-com model as is without making any changes to it and extracted an energy plus file. I wanted to understand the cooling peak load component so ran the facility component as well air loop summary report. I was surprised to see that the 'fenestration solar' component was zero. What could be the reason? Am I missing something? I have attached a link to the model- image description

https://drive.google.com/open?id=1QH6...

Thanks Ranjani

edit retag flag offensive close merge delete

Comments

@AaronBoranian @DavidGoldwasser @DavidReddy Any thoughts?

Ranjani's avatar Ranjani  ( 2018-11-20 23:28:21 -0500 )edit

What time is the peak?

JasonGlazer's avatar JasonGlazer  ( 2018-11-21 09:22:26 -0500 )edit

@JasonGlazer I extracted two reports from E+- Facility Component Summary as well as Air Loop Component Summary. I have attached them here- https://drive.google.com/open?id=1tFo... Facility Component report shows that the fenestration solar value is zero, whereas the air loop component report shows its 5% of the total. The time of peak is 9/21.

Ranjani's avatar Ranjani  ( 2018-11-24 13:13:01 -0500 )edit

1 Answer

Sort by ยป oldest newest most voted
1

answered 2018-11-26 07:47:41 -0500

updated 2018-11-26 07:53:45 -0500

From the report that you shared, the time of day for the facility peak is 5:15 am on Sep 21. I would guess that at that time of day there is no solar load. Although I also see that the estimate on the component loads is not a very good one. The line "Difference Between Peak and Estimated Sensible Load " is very large so I would not trust the component loads. Please review the input output reference and the engineering reference.

edit flag offensive delete link more

Comments

@JasonGlazer thanks for your reply. What are the reports I can check for peak load breakdown? The issue I am trying to solve is to show the difference in energy and HVAC downsizing between two glass types. I want to better understand why I don't see any savings. Not sure if the T24 prototype model is correct? or any component gets missed out when switching between softwares- CBECC-Com>OpenStudio>EnergyPlus.

Thanks Ranjani

Ranjani's avatar Ranjani  ( 2018-11-27 16:20:05 -0500 )edit

In EnergyPlus the peak load breakdown is a side calculation that is performed only for the component loads summary reports. The main heat balance algorithm does not include calculating that and that is why I suggested that you do not trust the component loads summary report when the "Difference Between Peak and Estimated Sensible Load " is very large. Several other reports will display the peak loads and sizing information including the HVAC Sizing Summary, Initialization Summary, Coil Sizing Details. You can trust them to be the sizing that EnergyPlus is using.

JasonGlazer's avatar JasonGlazer  ( 2018-11-28 06:43:11 -0500 )edit

Your Answer

Please start posting anonymously - your entry will be published after you log in or create a new account.

Add Answer

Careers

Question Tools

1 follower

Stats

Asked: 2018-10-30 23:53:51 -0500

Seen: 291 times

Last updated: Nov 26 '18