Question-and-Answer Resource for the Building Energy Modeling Community
Get started with the Help page
Ask Your Question
1

District Heating - Dymola

asked 2018-01-04 05:16:48 -0500

RicardoPereira's avatar

I am trying to validate a district heating model I built using Dymola.

In this case, I am trying to find the mass flow during a year period. I have two models running. both with the same loads and pipes with same characteristics as this picture:

Pipes

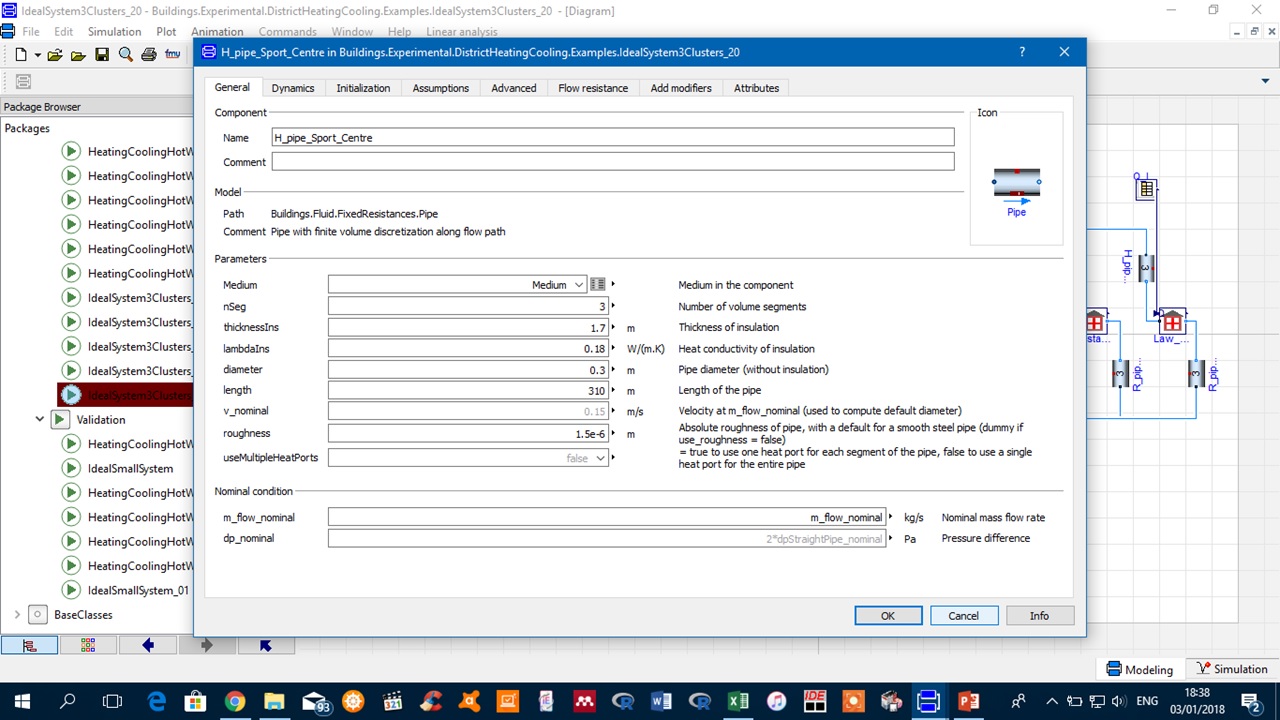
Both models are as follows:

Models

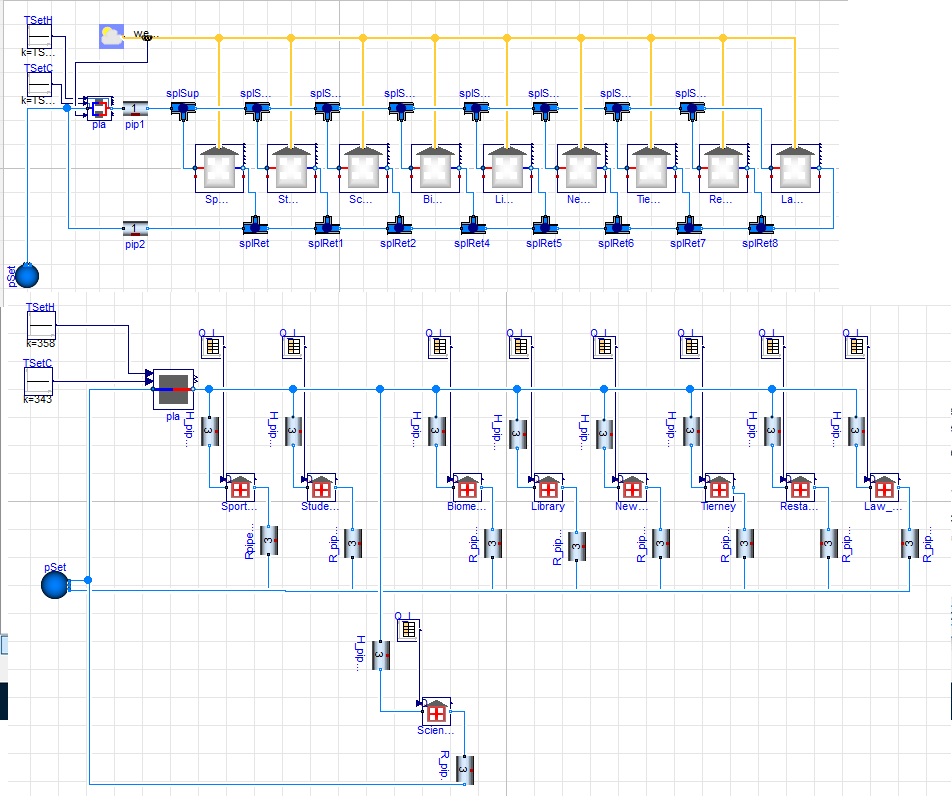
My results are making sense at least regarding the time of the year my flow should be higher, I am getting very high values during January, February and March, then again by the end of the year.

However those high peaks are VERY different, the first model on the picture is giving me peaks of almost 400kg/s whereas the second one is reaching up to 70kg/s.

Can anyone suggest a way to validate the model? I have the heat loads for the year hour by hour (this is the input I am giving to Dymola), I know that the min temperature of the water is 70 and the max is 85 celsius.

But I am really struggling to validate my model. Any suggestions?

edit retag flag offensive close merge delete

1 Answer

Sort by » oldest newest most voted
1

answered 2018-01-04 13:47:58 -0500

I think you are comparing apples with oranges. The top-model is a bi-directional district heating and cooling system with heat pumps and chillers in each building; whereas the bottom-model has only a central chiller and heater. Also, the top-level model is not designed for 70 to 85C water temperatures, but rather a water temperature in the distribution pipes that is near ambient. See for example the paper below and its references for how these systems are designed and operated:

Felix Bünning, Michael Wetter, Marcus Fuchs and Dirk Müller. Bidirectional low temperature district energy systems with agent-based control: Performance comparison and operation optimization. Applied Energy, Vol. 209, p. 502-515. 2017. https://doi.org/10.1016/j.apenergy.20...

Also available as LBNL Technical Report LBNL-2001090. http://simulationresearch.lbl.gov/wet...

In addition, you should check the model implementations (and their info section) for the assumptions made in these models, as the models are done for conceptual analysis, and not for detailed simulation as you would need if you want to validate a model, possibly against measured data?

edit flag offensive delete link more

Comments

Thanks very much for the insight! is it possible to use the more realistic Plant from the top model on the second one, that works with an ideal plant? I tried to do this and I got: Failed in sorting the initialization equations. Is it possible to fix this error or, in this case it wont work in anyway

RicardoPereira's avatar RicardoPereira  ( 2018-01-11 06:17:12 -0500 )edit

While it should be possible to use the plant from the top, I don't think it will result in a model that has the physics you need. Why would you be interested in modeling the vapor compression system in the plant, but not in the buildings? I don't think mixing the two models results in a system for which you can defend its physical assumptions. If you have problems, I rather suggest you decompose the system and tests its smaller subsystems. See http://simulationresearch.lbl.gov/mod...

Michael Wetter's avatar Michael Wetter  ( 2018-01-11 20:22:25 -0500 )edit

Thanks again, I tried to do this, but my experience with dymola is very limited, I am getting results now, but they are not sensitive to almost any parameter I change on my model, I even changed the pipes for this one https://www.sciencedirect.com/science...

but still all my changes are very linear, I don't think I can finish even a small system, that can be sensitive to at least 3 or four parameters, in time.

RicardoPereira's avatar RicardoPereira  ( 2018-01-11 21:21:21 -0500 )edit

Your Answer

Please start posting anonymously - your entry will be published after you log in or create a new account.

Add Answer

Careers

Question Tools

1 follower

Stats

Asked: 2018-01-04 05:16:48 -0500

Seen: 906 times

Last updated: Jan 04 '18