I am trying to validate a district heating model I built using Dymola.
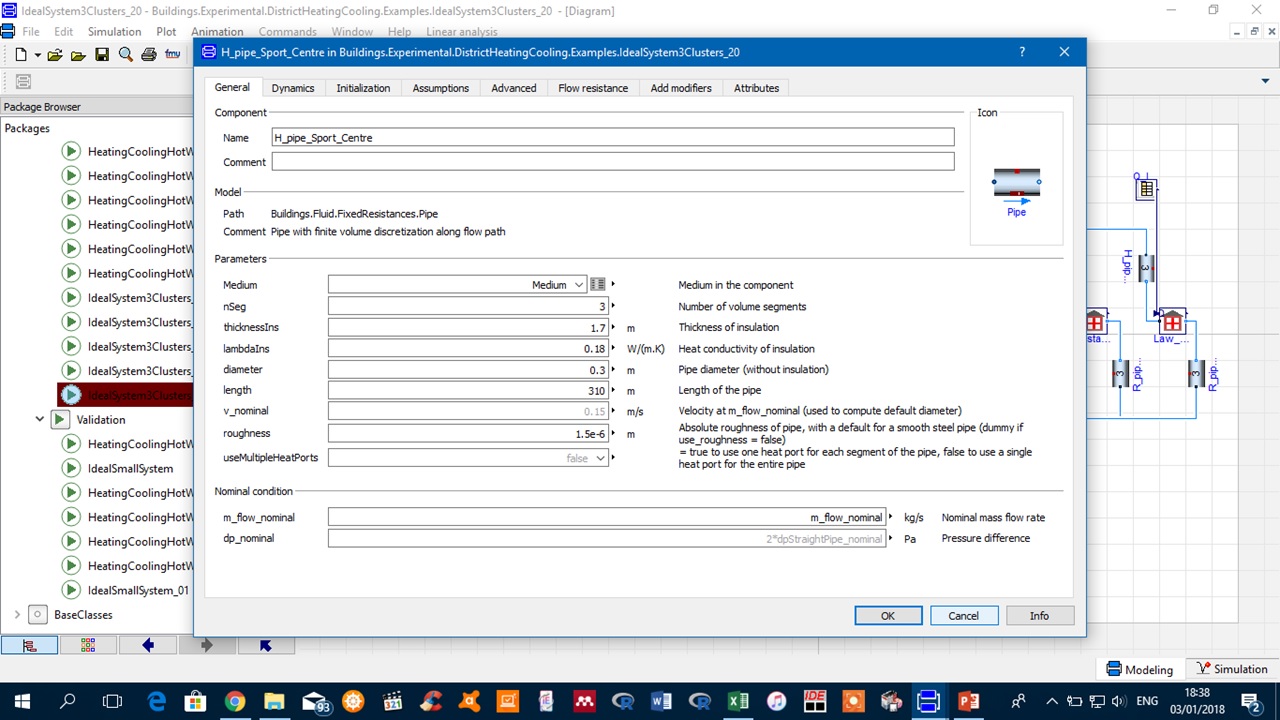
In this case, I am trying to find the mass flow during a year period. I have two models running. both with the same loads and pipes with same characteristics as this picture:

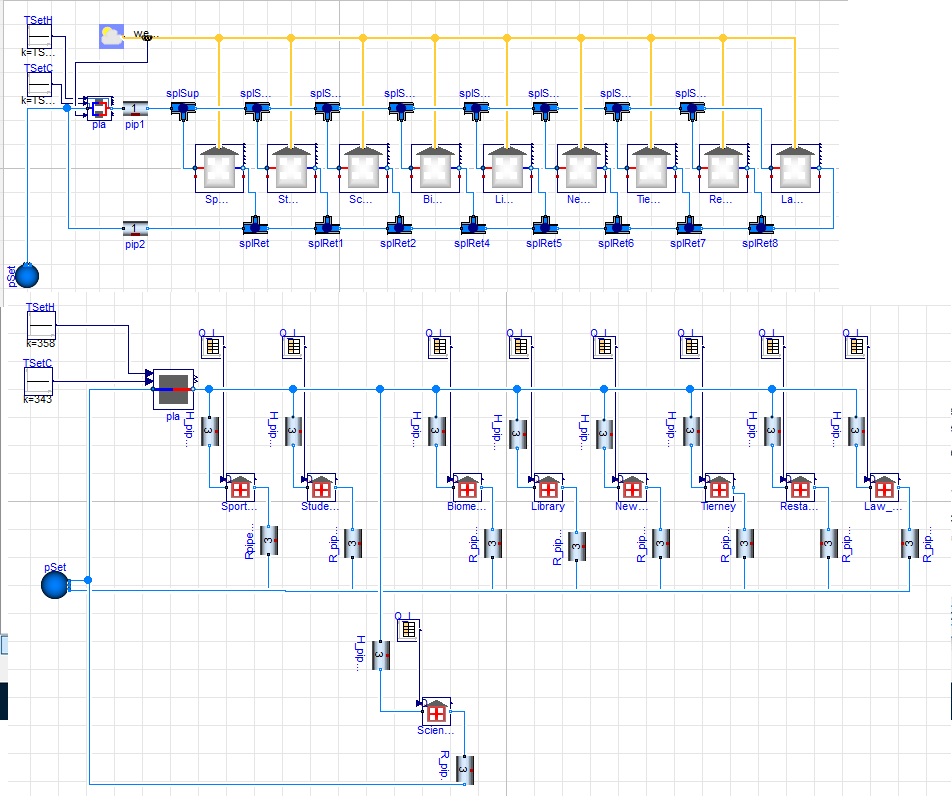
Both models are as follows:

My results are making sense at least regarding the time of the year my flow should be higher, I am getting very high values during January, February and March, then again by the end of the year.
However those high peaks are VERY different, the first model on the picture is giving me peaks of almost 400kg/s whereas the second one is reaching up to 70kg/s.
Can anyone suggest a way to validate the model? I have the heat loads for the year hour by hour (this is the input I am giving to Dymola), I know that the min temperature of the water is 70 and the max is 85 celsius.
But I am really struggling to validate my model. Any suggestions?


