Question-and-Answer Resource for the Building Energy Modeling Community
Get started with the Help page
Ask Your Question
2

openstudio results with charts

asked 2017-12-19 23:36:07 -0600

FN's avatar

updated 2017-12-20 11:15:42 -0600

Is there anyway to set the overview use results as different pie and column charts?! I could see these charts in the openstudio results of my simulation but after I changed the input to see the impact, the second reports just give them in a table view format.

edit retag flag offensive close merge delete

2 Answers

Sort by ยป oldest newest most voted
3

answered 2017-12-20 14:39:47 -0600

@FN, based on your comment in @Avi's answer, my guess is that you didn't have an internet connection last night, but that you do today. The charts in the OpenStudio results measure use dimplejs and will only show up when you have an internet connection. When you are offline you can still see the tables but not the charts.

edit flag offensive delete link more

Comments

@David Goldwasser :You are right! now I remember, my internet connection was on and off last night! Thank you so much, I feel much better now:)

FN's avatar FN  ( 2017-12-20 14:43:37 -0600 )edit
2

answered 2017-12-20 02:22:13 -0600

Avi's avatar

updated 2017-12-20 12:27:03 -0600

In order to see the OpenStudio results report (The colorful one with all the charts) and not only the default EnergyPlus results, you need to download and activate the OpenStudio Results Measure as described in this post.

If you did that already then all you have to do is select the report type in the upper left corner of the Results Summary Tab as depicted in that picture: image description
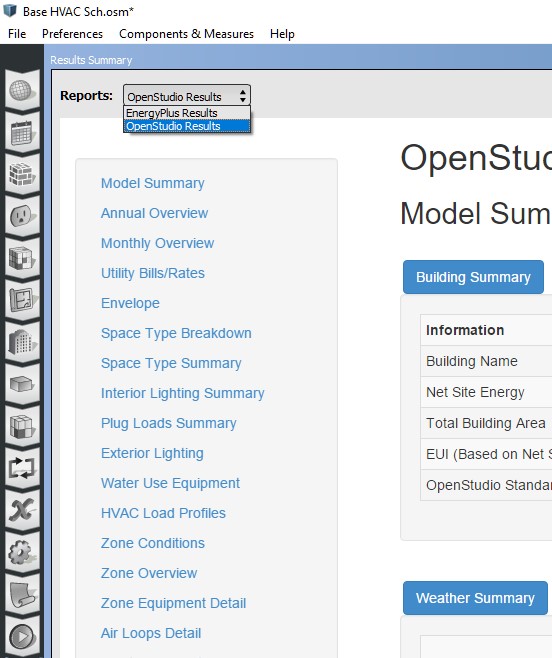
In order to activate the OS Results measure for that run you need to go to the Measures tab, then on the right side select the lIbrary tab>Reporting>QAQC now drag the OpenStudio Results into the Reporting Measure window on the center of the measure Tab and you are done.

After the run you can find both of the reports not only in the Results Summary Tab but also in the folder with the name of your model under subfolder ../run/ddd_OpenStudio Results. Where the dots represent the name of your model and ddd represent three digits. The file of the EnergyPlus report will be in the run folder named eplustbl. Both files are HTML format.

edit flag offensive delete link more

Comments

@Avi : Thanks, but like I said my new openstudio report Only has "view table" to review annual and monthly use data, while, the first report ( before changing few input and running OS again) the reports had both charts + tables! I guess I have to export the results into the excel, but I was not sure there is no other way to set and see those charts automatically in OS report again.

FN's avatar FN  ( 2017-12-20 08:06:46 -0600 )edit

Thank you! Last night when I posted my question, my report didn't represent any beautiful chart ( pie or column chart) in my reports, but today when I opened it again, I have both tables and charts! it is ame report and I didn't change anything! I am confused why but everything is ok now!

FN's avatar FN  ( 2017-12-20 12:59:26 -0600 )edit

Your Answer

Please start posting anonymously - your entry will be published after you log in or create a new account.

Add Answer

Training Workshops

Careers

Question Tools

1 follower

Stats

Asked: 2017-12-19 23:36:07 -0600

Seen: 1,068 times

Last updated: Dec 20 '17