Question-and-Answer Resource for the Building Energy Modeling Community
First time here? Check out the Help page!
| | 1 | initial version |
In order to see the OpenStudio results report (The colorful one with all the charts) and not only the default EnergyPlus results, you need to download and activate the OpenStudio Results Measure as described in this post.
If you did that already then all you have to do is select the report type in the upper left corner of the Results Summary Tab as depicted in that picture:
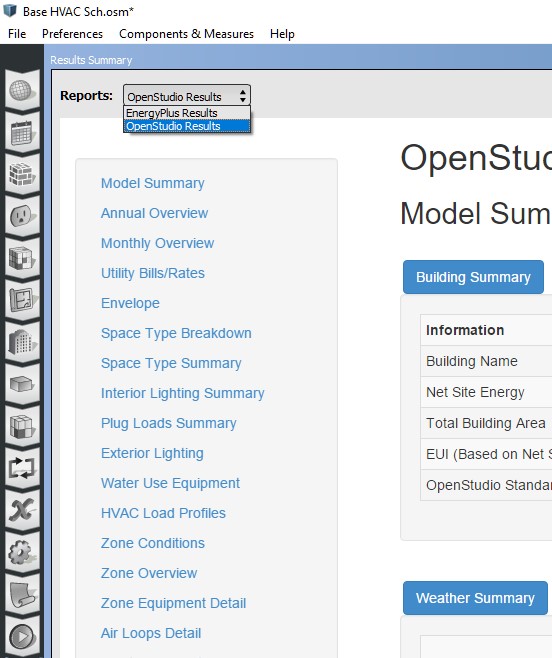
| | 2 | No.2 Revision |
In order to see the OpenStudio results report (The colorful one with all the charts) and not only the default EnergyPlus results, you need to download and activate the OpenStudio Results Measure as described in this post.
If you did that already then all you have to do is select the report type in the upper left corner of the Results Summary Tab as depicted in that picture:
In order to activate the OS Results measure for that run you need to go to the Measures tab, then on the right side select the lIbrary tab>Reporting>QAQC now drag the OpenStudio Results into the Reporting Measure window on the center of the measure Tab and you are done.
After the run you can find both of the reports not only in the Results Summary Tab but also in the folder with the name of your model under subfolder ../run/ddd_OpenStudio Results. Where the dots represent the name of your model and ddd represent three digits. The file of the EnergyPlus report will be in the run folder named eplustbl. Both files are HTML format.

