Question-and-Answer Resource for the Building Energy Modeling Community
Get started with the Help page
Ask Your Question
2

Balance Point for the thermal zones

asked 2017-09-19 16:36:47 -0500

updated 2017-09-20 02:38:33 -0500

How can I calculate the balance point temperature (wikipedia) in Openstudio?

Is it right to assume that if the cooling load is zero for a zone, it means we have a "balance point" situation in it?

Is there any report that allows us to know what will be the outside temperature when we attain this condition?

I went through some old posts, but didn't find a lot of information on it.

edit retag flag offensive close merge delete

2 Answers

Sort by » oldest newest most voted
1

answered 2017-09-20 12:53:21 -0500

updated 2017-09-20 12:57:57 -0500

I did my own research last night as per the attached paper & other info.

Let me explain what was the intention of having a balance point temperature. I wanted to know the balance point temperature to understand when exactly my Q(envelope loss) is lesser than Q(internal gain)+Q(sol). I wanted this information as the hourly values for just South facing zones as the architects wants to have a dynamic shades only for the times when there is a 'direct glare in the space' + 'cooling need".

As cooling is needed only if the Outside temperature is higher than the "balance point temperature", I just needed to generate the hourly reports for 1. outside temperature, 2. Cooling load for the selected zone. Whenever the cooling load is equal to zero, the outside temperature will be considered as the balance point temperature for that particular hour.

I also created 2 more reports on hourly basis: 1. Vertical solar angle on the window 2. Horizontal solar angle on the window.

Now, in the excel report, I used an IF+AND+OR statement to understand when exactly I need to have the shade on the window for south facing space. I need the shade when 1. Cooling load is more than zero, 2. Horizontal or vertical angle is more than zero (which means there is a direct sunlight falling on the window).

It's a very high level study for now followed by some more ladybug runs for the dynamic shades, but atleast gives a rough idea for how many hours we need the shade & what's going to be it's depth.

I just wanted to share what I found out, in case someone else have this question in the future.

edit flag offensive delete link more
4

answered 2017-09-20 02:37:00 -0500

TL,DR: This has nothing to do with OpenStudio, in the sense that there isn't to my knowledge any reporting measure that does it. But as with any other software, you can use the consumption output from the building energy model and apply regression techniques to it.


So the simple form of linear regression, in matrix notation is $X \beta = Y$

where:

  • $Y$ is your independent variable (the electricity consumption for each of 12 months for example),
  • $X$ is your dependent variables, and,
  • $\beta$ is a column vector of parameters, for example a baseload coefficient, a heating coefficient, and a cooling coefficient

In a typical application for residential, $X$ will be a (12,3) matrix. 12 rows for each month, and 3 columns: number of days, HDD65, CDD65 or. In such a case, the balance point temperature is 65F for both heating and cooling, and it’s fixed. The HDD65 can be calculated in a few different ways: $max(T- 65,0)$, where T can be the average hourly temperature for the 24 hours, or the daily $\frac{T_{out,max} - T_{out,min}}{2}$ which some may claim better captures thermal inertia of the building.

65°F (or 18°C in the rest of the world) is usually the most appropriate balance point temperature for residential applications, but that's completely empiric. In a commercial application such as an office, the balance point for cooling is usually closer to 55°F (due to high internal loads).

image description

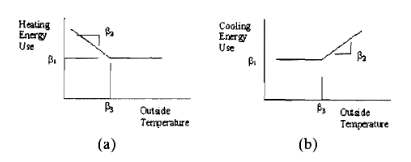
So in this case $B_3$ would be 65 in the above graph.

If you want to also vary $B_3$ in both cases, it has been coined - I believe - by Kissock, Haberl and Claridge in the development of the ASHRAE “Inverse Modelling Toolkit” as “Change point models”, each refered as either 3-P cooling, 3-P heating, 4-P heating and cooling, and finally 5-P heating and cooling

image description

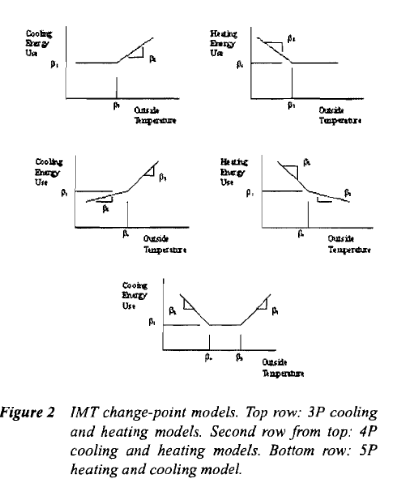
You can read more in KC-03-2-1 (RP-1050) - Inverse Modeling Toolkit - Numerical Algorithms here

It has the matrix notation for each “model”


As a reminder, for the simple use case, you can just use matrix algebra,

$$X \beta = Y$$ $$\Leftrightarrow X^T X B = X^T Y$$

Here $X^T X$ is by definition a square matrix. If you were a good lad, you’d verify that this square matrix can be inversed by looking at its determinant. But this is the real world, so this matrix can always be inversed, so just go ahead

$$=> (X^T X)^{-1} X^T X B = (X.T X)^-1 X.T Y <=> B = (X^T X)^{-1} X^T Y$$

As a reminder (or not), you don’t need anything fancy to solve it that way. This can be done directly in Excel. I haven’t used excel in a while, but I believe this should be about right

=MMULT(MMULT(MINVERSE(MMULT(TRANSPOSE(X),X)),TRANSPOSE(X)),Y)

Which you need to enter as an array formula by selecting a an array of 3 rows and 1 column, enter the ... (more)

edit flag offensive delete link more

Comments

Thanks for the effort. Just for your FYI, ECAM tool (https://www.cacx.org/PIER/ecam/) is also a great tool for M&V stuff what you've explained above. It gives a great change-model curve types with rest of the information.

Harshul Singhal's avatar Harshul Singhal  ( 2017-09-20 12:34:45 -0500 )edit

Your Answer

Please start posting anonymously - your entry will be published after you log in or create a new account.

Add Answer

Training Workshops

Careers

Question Tools

1 follower

Stats

Asked: 2017-09-19 16:36:47 -0500

Seen: 443 times

Last updated: Sep 20 '17