Question-and-Answer Resource for the Building Energy Modeling Community
| | 1 | initial version |
TL,DR: This has nothing to do with OpenStudio, in the sense that there isn't to my knowledge any reporting measure that does it. But as with any other software, you can use the consumption output from the building energy model and apply regression techniques to it.
So the simple form of linear regression, in matrix notation is $X \beta = Y$
where:
In a typical application for residential, $X$ will be a (12,3) matrix. 12 rows for each month, and 3 columns: number of days, HDD65, CDD65 or. In such a case, the balance point temperature is 65F for both heating and cooling, and it’s fixed. The HDD65 can be calculated in a few different ways: $max(T- 65,0)$, where T can be the average hourly temperature for the 24 hours, or the daily $\frac{T_{out,max} - T_{out,min}}{2}$ which some may claim better captures thermal inertia of the building.
65°F (or 18°C in the rest of the world) is usually the most appropriate balance point temperature for residential applications, but that's completely empiric. In a commercial application such as an office, the balance point for cooling is usually closer to 55°F (due to high internal loads).
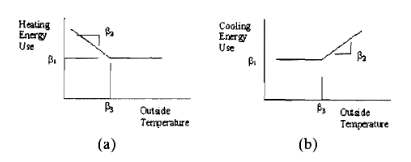
So in this case $B_3$ would be 65 in the above graph.
If you want to also vary $B_3$ in both cases, it has been coined - I believe - by Kissock, Haberl and Claridge in the development of the ASHRAE “Inverse Modelling Toolkit” as “Change point models”, each refered as either 3-P cooling, 3-P heating, 4-P heating and cooling, and finally 5-P heating and cooling
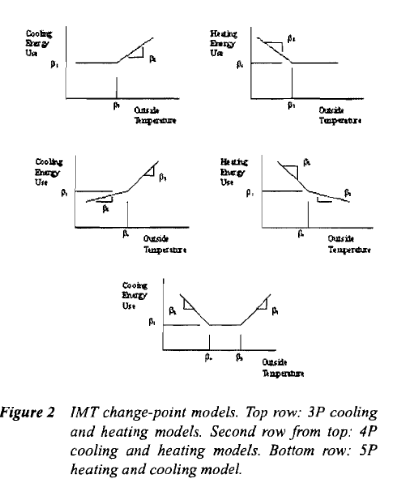
You can read more in KC-03-2-1 (RP-1050) - Inverse Modeling Toolkit - Numerical Algorithms here
It has the matrix notation for each “model”
As a reminder, for the simple use case, you can just use matrix algebra,
$$X \beta = Y$$ $$\Leftrightarrow X^T X B = X^T Y$$
Here $X^T X$ is by definition a square matrix. If you were a good lad, you’d verify that this square matrix can be inversed by looking at its determinant. But this is the real world, so this matrix can always be inversed, so just go ahead
$$=> (X^T X)^{-1} X^T X B = (X.T X)^-1 X.T Y <=> B = (X^T X)^{-1} X^T Y$$
As a reminder (or not), you don’t need anything fancy to solve it that way. This can be done directly in Excel. I haven’t used excel in a while, but I believe this should be about right
=MMULT(MMULT(MINVERSE(MMULT(TRANSPOSE(X),X)),TRANSPOSE(X)),Y)
Which you need to enter as an array formula by selecting a an array of 3 rows and 1 column, enter the formula and use CTRL+MAJ+ENTER
If you don’t want to use Excel, you can also get E-tracker by Kissock here
It will test all models and return the most appropriate one. But it’s awkward to work with in my opinion.
That’s what NYSERDA makes (or used to make) you use if you participate in their Existing Buildings Multifamily Performance Program for example.
(Did I just hear someone say “Too much information” in the back of the room?!)


