Question-and-Answer Resource for the Building Energy Modeling Community
Get started with the Help page
Ask Your Question
5

ResultsViewer-saved graphs: poor image quality

asked 9 years ago

updated 7 years ago

When saving graphs in ResultsViewer to png image format, I have noticed that the ResultsViewer shipped with OpenStudio 1.8.0 produces much poorer quality than in previous release(s). See an example:
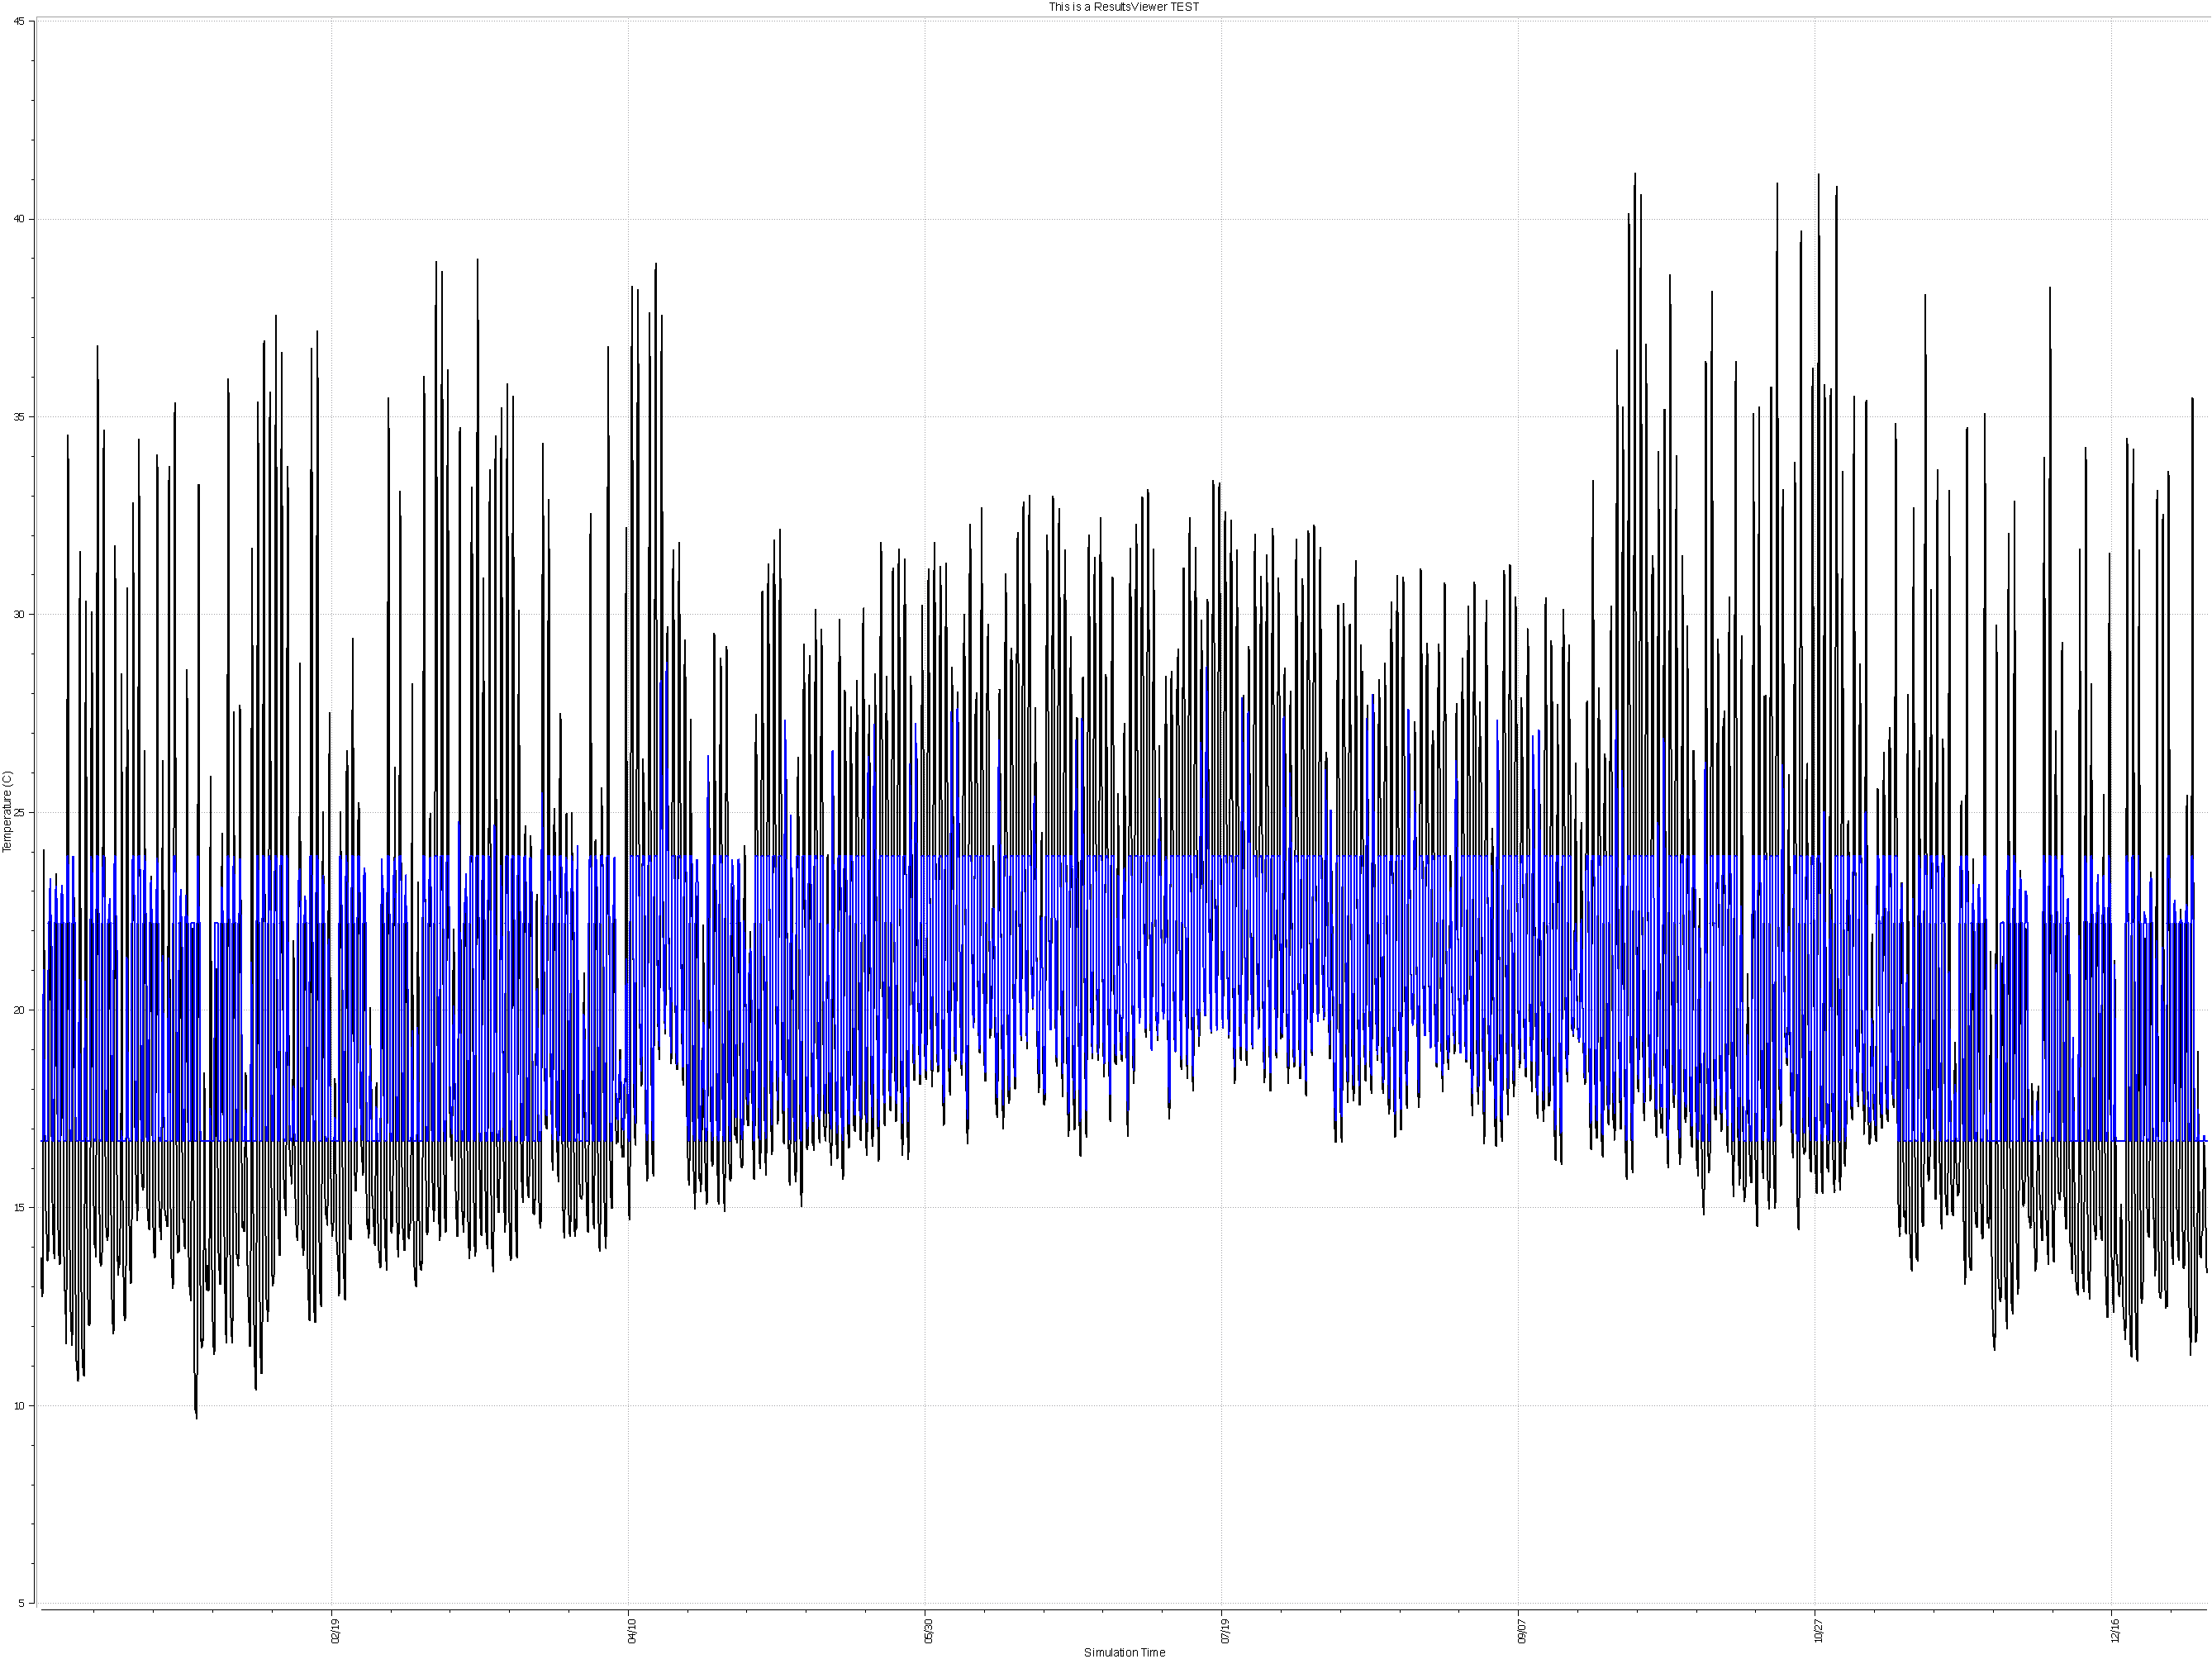
image description

Here the legend is missing and the text descriptions are poorly legible. Compare this with a screenshot of the same graph:
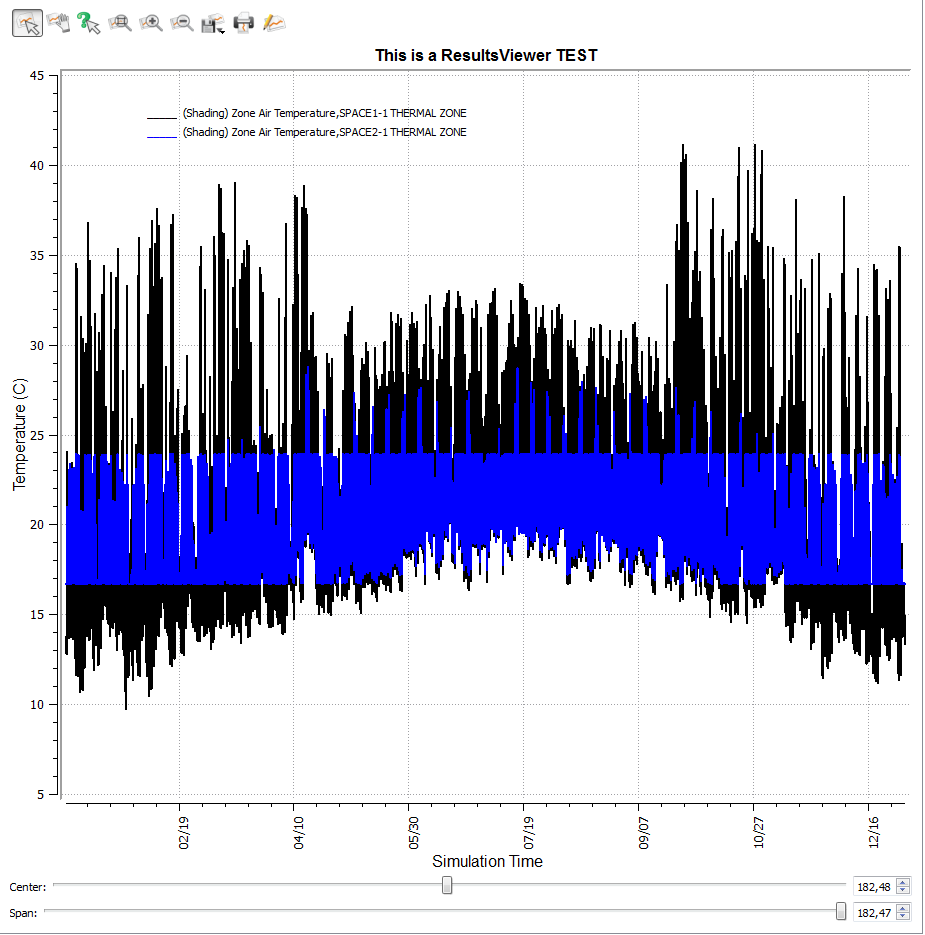
image description

Have I perhaps overlooked some (new) user or system settings to avoid this or is this a software glitch ?

My operating system is Windows7 32bit with OpenStudio 1.8.0 + separately installed EnergyPlus 8.3.0 (because bundled EnergyPlus crashes; cf. issue reported. ).

Preview: (hide)

1 Answer

Sort by » oldest newest most voted
6

answered 9 years ago

This was likely caused when we updated to Qwt 6.1.2 (which is still the most current version). I added this issue. However, our current focus is on reporting measures leveraging html plotting features. Have you played around with any of those yet?

Preview: (hide)
link

Comments

Well, using ResultsViewer is very easy and convenient. I have not tried (standard) reporting measures yet, but then the question arises, how flexible and easy-to-use it is to define specific graphs or plots without having to write own measures...?

OS-user-AT's avatar OS-user-AT  ( 9 years ago )

Your Answer

Please start posting anonymously - your entry will be published after you log in or create a new account.

Add Answer

Training Workshops

Careers

Question Tools

1 follower

Stats

Asked: 9 years ago

Seen: 172 times

Last updated: Sep 10 '15