Question-and-Answer Resource for the Building Energy Modeling Community
Get started with the Help page
Ask Your Question
5

ResultsViewer-saved graphs: poor image quality

asked 2015-09-10 06:16:09 -0500

updated 2017-09-25 15:37:45 -0500

When saving graphs in ResultsViewer to png image format, I have noticed that the ResultsViewer shipped with OpenStudio 1.8.0 produces much poorer quality than in previous release(s). See an example:

image description

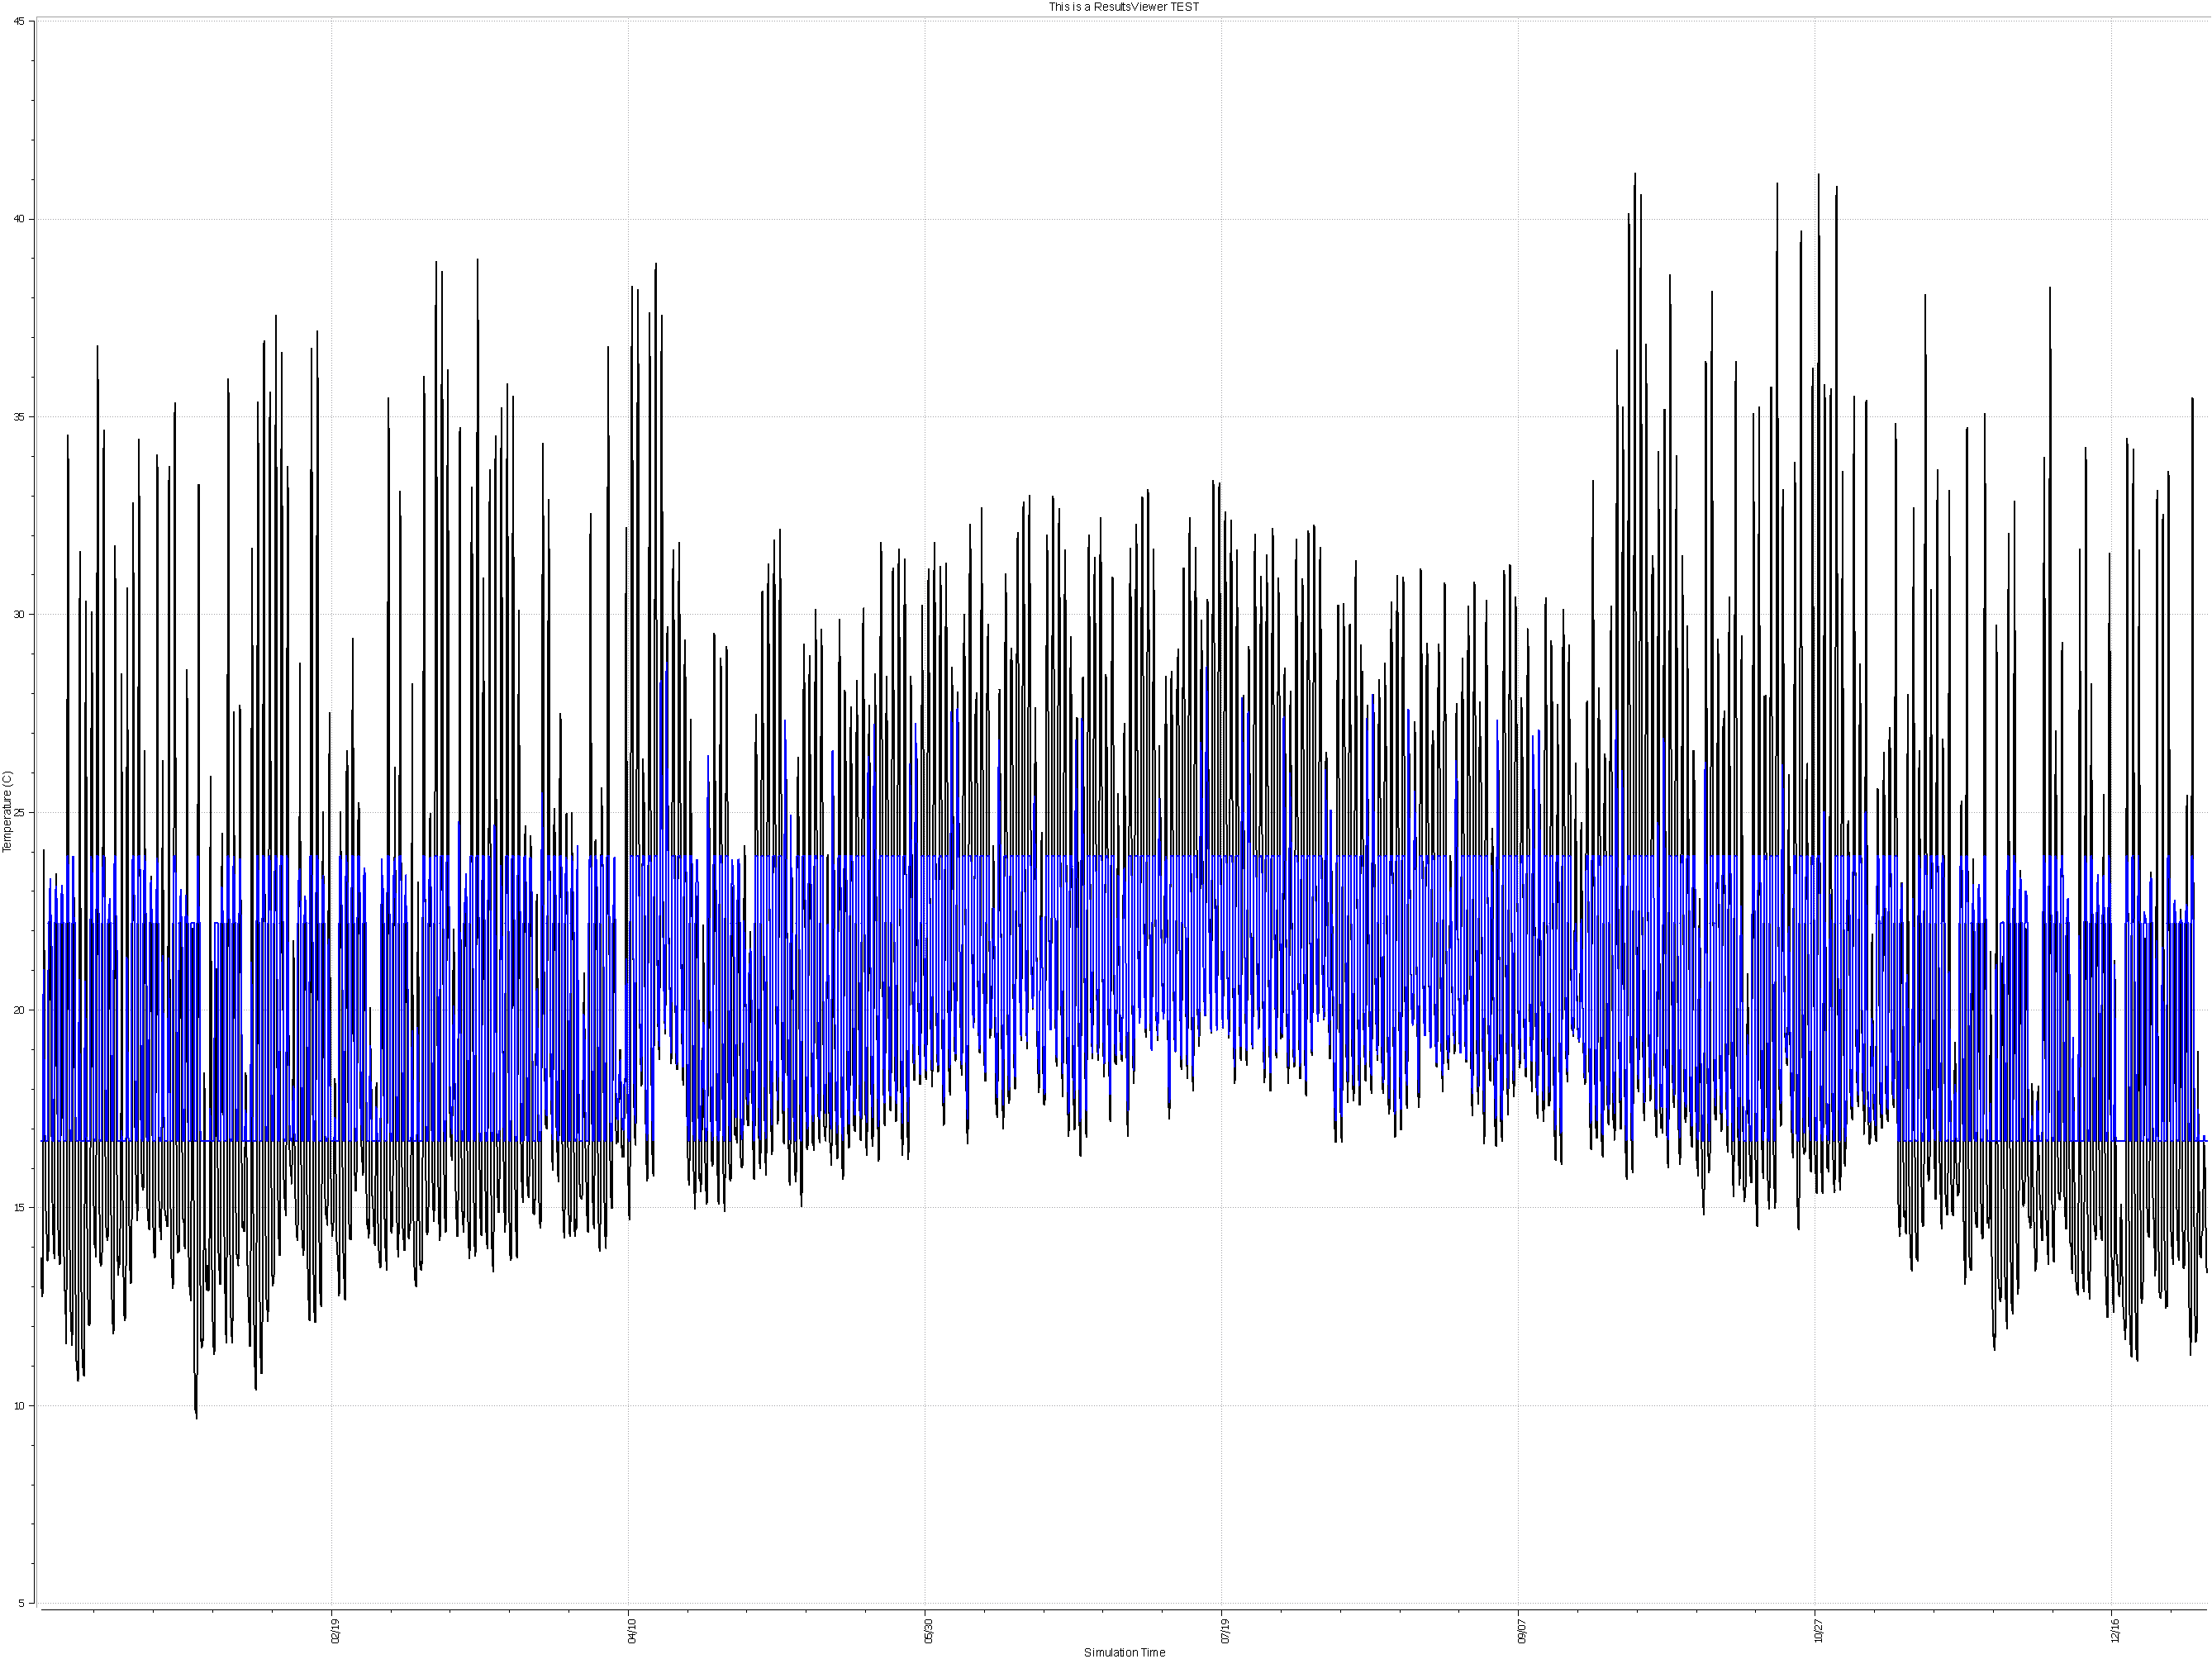
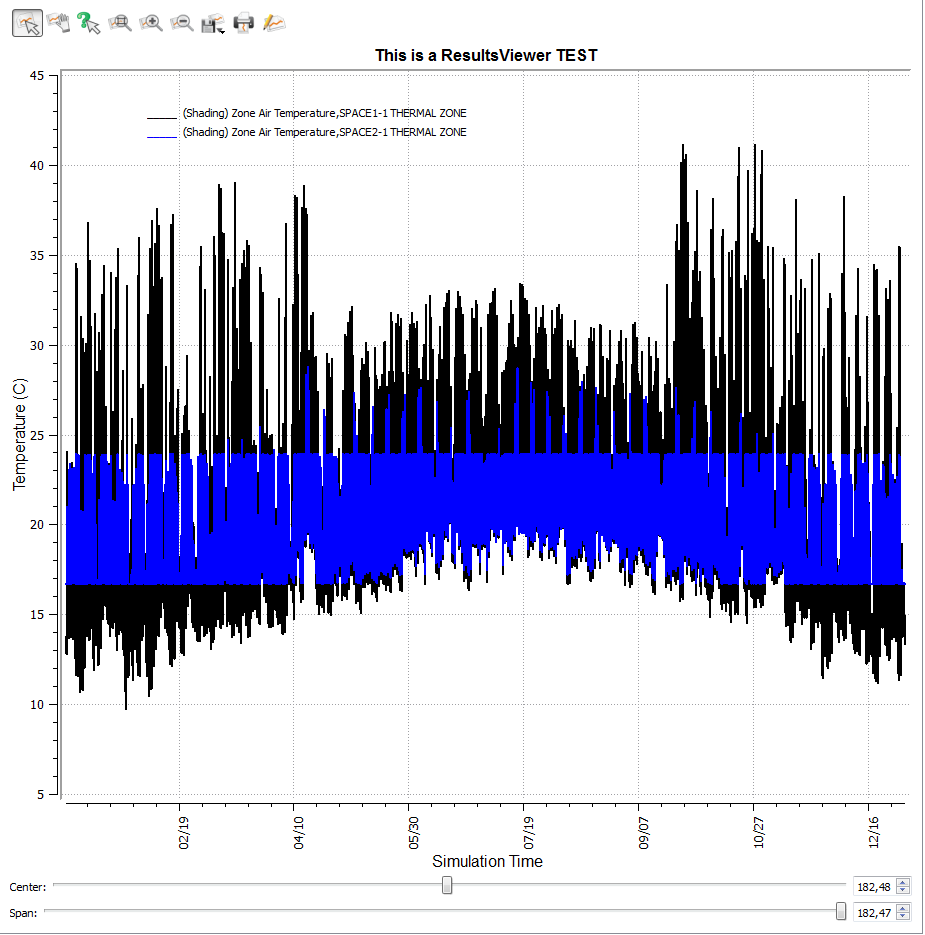
Here the legend is missing and the text descriptions are poorly legible. Compare this with a screenshot of the same graph:

image description

Have I perhaps overlooked some (new) user or system settings to avoid this or is this a software glitch ?

My operating system is Windows7 32bit with OpenStudio 1.8.0 + separately installed EnergyPlus 8.3.0 (because bundled EnergyPlus crashes; cf. issue reported. ).

edit retag flag offensive close merge delete

1 Answer

Sort by ยป oldest newest most voted
6

answered 2015-09-10 09:29:24 -0500

This was likely caused when we updated to Qwt 6.1.2 (which is still the most current version). I added this issue. However, our current focus is on reporting measures leveraging html plotting features. Have you played around with any of those yet?

edit flag offensive delete link more

Comments

Well, using ResultsViewer is very easy and convenient. I have not tried (standard) reporting measures yet, but then the question arises, how flexible and easy-to-use it is to define specific graphs or plots without having to write own measures...?

OS-user-AT's avatar OS-user-AT  ( 2015-09-10 11:05:24 -0500 )edit

Your Answer

Please start posting anonymously - your entry will be published after you log in or create a new account.

Add Answer

Careers

Question Tools

1 follower

Stats

Asked: 2015-09-10 06:16:09 -0500

Seen: 149 times

Last updated: Sep 10 '15