Question-and-Answer Resource for the Building Energy Modeling Community
First time here? Check out the Help page!
| | 1 | initial version |
You are correct that the answer is No. In the snapshot you posted the curves are for atmospheric (natural draft) boilers. In this case the independent variable is Part Load Ratio, which is unitless. But the output of the DOE/eQuest curve is a modifier to the nominal Heat Input Ratio (1/efficiency), and the Output of the E+ curve is a modifier to the nominal efficiency. To compare output values you have to convert them to the same result. I got the following from my calcs, using a nominal 0.82 rated efficiency value:
They are pretty close except in the lowest PLR range. How much impact this has will depend on the min PLR allowed for the boiler. Also, note that Appendix 5.7 lists an Min Out value of 0.75 for the E+ curve (in cell reference AH94 of the spreadsheet). DOE2 doesn't have this, but the curve definitions in E+ allow you to put bounding limits on curve results. You would need to look at the Performance Curve object to see if that limit is implemented. If it is, it that would have a very significant impact on natural draft boiler energy use in the simulation. Also, DOE2/eQuest has inputs for "startup" and "standby" losses which are influential to boiler energy use (increasing) that E+ does not have (as far as I know).
| | 2 | No.2 Revision |
You are correct that the answer is No. In the snapshot you posted the curves are for atmospheric (natural draft) boilers. In this case the independent variable is Part Load Ratio, which is unitless. But the output of the DOE/eQuest curve is a modifier to the nominal Heat Input Ratio (1/efficiency), and the Output of the E+ curve is a modifier to the nominal efficiency. To compare output values you have to convert them to the same result.
I got the following from my calcs, using a nominal 0.82 0.80 rated efficiency value:
They are pretty close except in the lowest PLR range. How much impact this has will depend on the min PLR allowed for the boiler. Also, note that Appendix 5.7 lists an Min Out value of 0.75 for the E+ curve (in cell reference AH94 of the spreadsheet). DOE2 doesn't have this, but the curve definitions in E+ allow you to put bounding limits on curve results. You would need to look at the Performance Curve object to see if that limit is implemented. If it is, it that would have a very significant impact on natural draft boiler energy use in the simulation. Also, DOE2/eQuest has inputs for "startup" and "standby" losses which are influential to boiler energy use (increasing) that E+ does not have (as far as I know).
| | 3 | No.3 Revision |
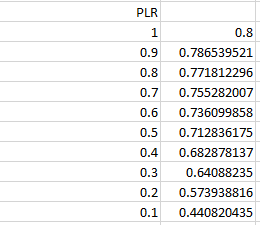
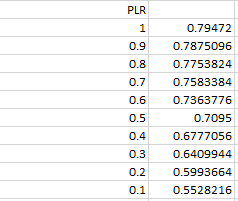
You are correct that the answer is No. In the snapshot you posted the curves are for atmospheric (natural draft) boilers. In this case the independent variable is Part Load Ratio, which is unitless. But the output of the DOE/eQuest curve is a modifier to the nominal Heat Input Ratio (1/efficiency), and the Output of the E+ curve is a modifier to the nominal efficiency. To compare output values you have to convert them to the same result. I got the following from my calcs, using a nominal 0.80 rated efficiency value:
They are pretty close except in the lowest PLR range. How much impact this has will depend on the min PLR allowed for the boiler. Also, note that Appendix 5.7 5.7 lists an Min Out value of 0.75 for the E+ curve (in cell reference AH94 of the spreadsheet). DOE2 doesn't have this, but the curve definitions in E+ allow you to put bounding limits on curve results. You would need to look at the Performance Curve object to see if that limit is implemented. If it is, it that would have a very significant impact on natural draft boiler energy use in the simulation. Also, DOE2/eQuest has inputs for "startup" and "standby" losses which are influential to boiler energy use (increasing) that E+ does not have (as far as I know).
Another thing I have noticed in E+ that has a big influence on boiler energy use is the input to the field Boiler Flow Mode in the Boiler:HotWater object.
| | 4 | No.4 Revision |
You are correct that the answer is No. In the snapshot you posted the curves are for atmospheric (natural draft) boilers. In the spreadsheet Appendix 5.7, the blue values are indicated to be applicable for DOE2, while the red values are indicated to be applicable for E+. In this case the independent variable is Part Load Ratio, which is unitless. But the output of the DOE/eQuest curve is a modifier to the nominal Heat Input Ratio (1/efficiency), and the Output of the E+ curve is a modifier to the nominal efficiency. To compare output values you have to convert them to the same result. I got the following from my calcs, using a nominal 0.80 rated efficiency value:
They are pretty close except in the lowest PLR range. How much impact this has will depend on the min PLR allowed for the boiler. Also, note that Appendix 5.7 lists an Min Out value of 0.75 for the E+ curve (in cell reference AH94 of the spreadsheet). DOE2 doesn't have this, but the curve definitions in E+ allow you to put bounding limits on curve results. You would need to look at the Performance Curve object to see if that limit is implemented. If it is, it that would have a very significant impact on natural draft boiler energy use in the simulation. Also, DOE2/eQuest has inputs for "startup" and "standby" losses which are influential to boiler energy use (increasing) that E+ does not have (as far as I know).
Another thing I have noticed in E+ that has a big influence on boiler energy use is the input to the field Boiler Flow Mode in the Boiler:HotWater object.

