Question-and-Answer Resource for the Building Energy Modeling Community
First time here? Check out the Help page!
| 2021-07-27 21:09:59 -0500 | received badge | ● Notable Question (source) |
| 2020-01-20 13:36:10 -0500 | received badge | ● Popular Question (source) |
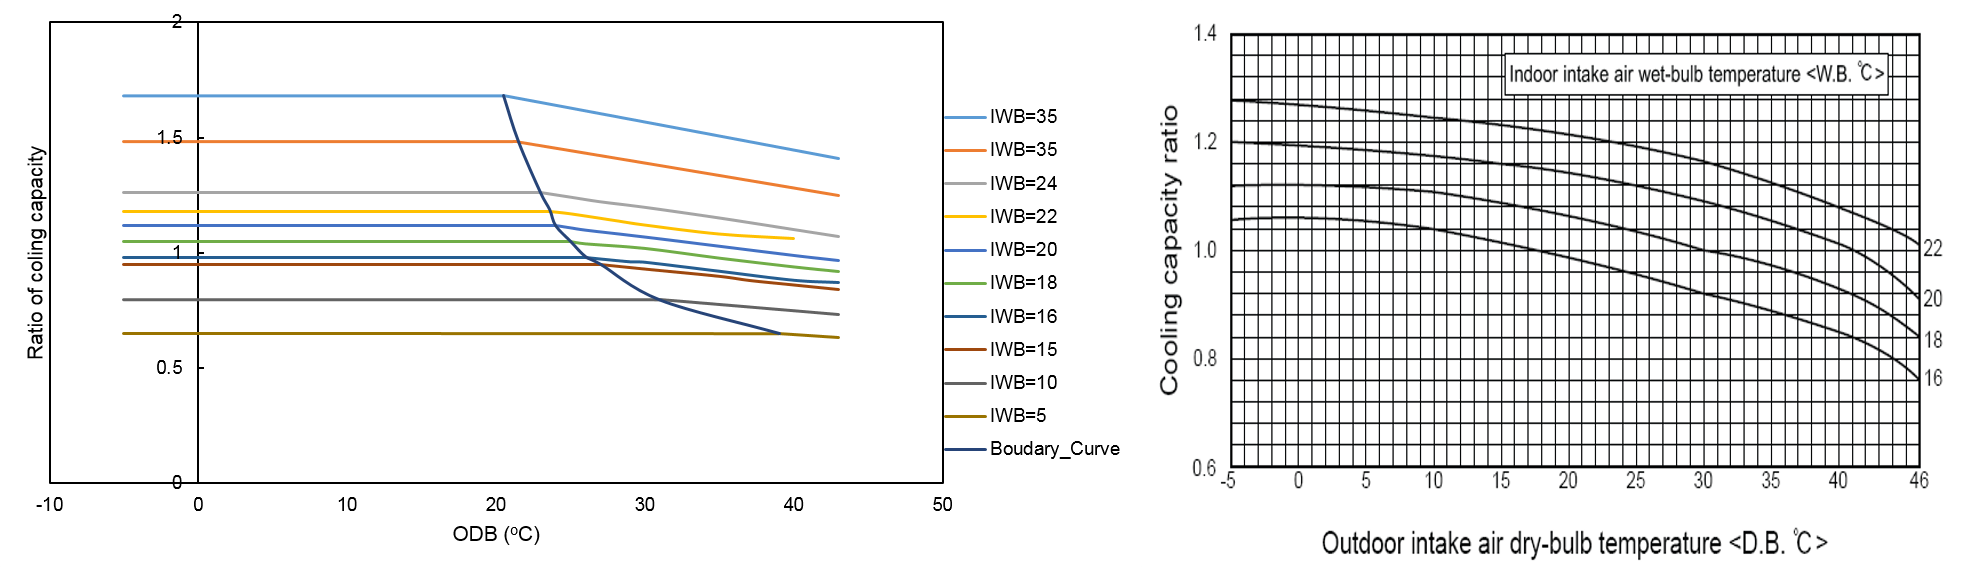
| 2016-04-13 10:40:07 -0500 | commented answer | VRF performance curve for non-flat low/high CapFT values @rraustad: I was wondering, if the low temperature curves are not straight in left hand side figure, then which equation to use for converting boudary curve temperature to CAPFT (i.e. low tempearture curves or high temperature curves). In the above left hand side figure it was easy as the low temperature curves were straight. |
| 2016-04-12 06:18:40 -0500 | commented answer | VRF performance curve for non-flat low/high CapFT values Thanks, I have it already. :) |
| 2016-04-12 06:18:31 -0500 | commented answer | VRF performance curve for non-flat low/high CapFT values Thanks, I will have a look. |
| 2016-04-11 13:14:02 -0500 | commented answer | VRF performance curve for non-flat low/high CapFT values @rraustad: Thanks for your answer, but in right hand side figure there is no distinct low and high temperature sides. How you would differentiate between these regions? P.S: The curve in left hand side figure is for another system not the one on right hand side. |
| 2016-04-11 11:24:02 -0500 | asked a question | VRF performance curve for non-flat low/high CapFT values I have developed a performance curve for a VRF system (Left-hand side figure). My questions are;
|
| 2016-01-07 14:31:25 -0500 | received badge | ● Scholar (source) |
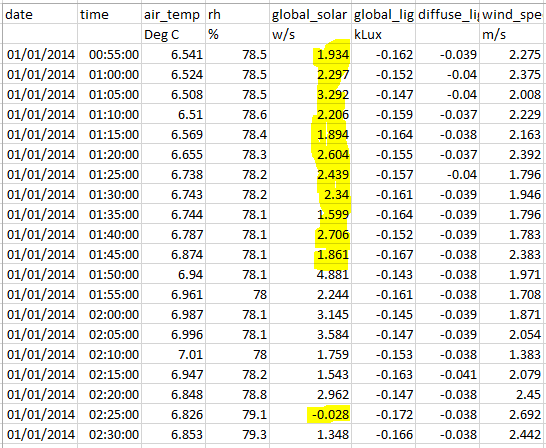
| 2016-01-06 11:57:49 -0500 | asked a question | Negative and positive values of Solar radiation during night I have some actual weather data that contains global solar radiation values. I have noticed that it has positive and negative values at night time, please see below. Should it be zero during night time or I am missing something? P.S: The unit is wrong for global solar radiation.
|
| 2015-10-04 19:22:00 -0500 | received badge | ● Student (source) |
| 2015-10-04 19:12:27 -0500 | asked a question | online Web tool for Revit model Hi, Does anyone know any online web tool that automatically generates revit models for performing energy simulations. I am interested in looking at its software architecture. Could you please guide me to some report or publication that explains its architecture or framework? Thanks |
| 2015-10-04 19:12:27 -0500 | asked a question | Revit models for Steady state and dynamic energy simulations Does anyone know the workflow to use revit models for performing steady state and dynamic energy simulations? I would appreciate if you could detail the steps required or guide me to some publications that has documented these steps. It would be great if you could mention the software that will be required e.g. Green Building Design Studio etc. Also, what will the inputs that will be required to carry out Steady state and dynamic energy simulations in those software. Thanks |