
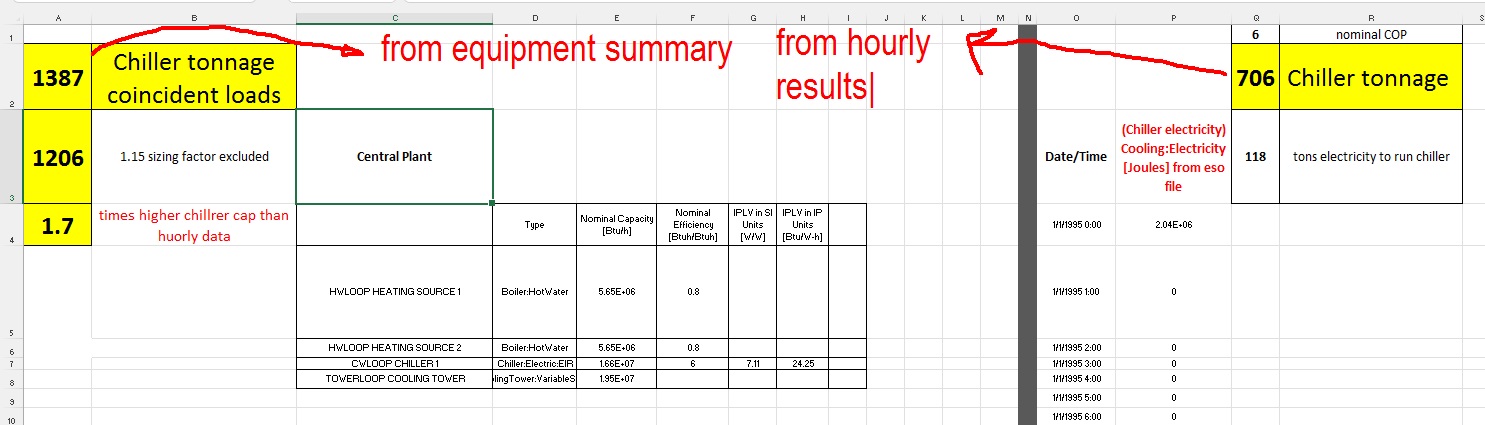
Working on an office renovation project in Northeast. The mechanical engineer is interested in knowing the chiller size resulting from recent arch modifications...Long story short, this has happened before too that I notice the chiller sizes reported in the equipment summary are way higher than expected compared to typical sizing benchmarks (around 250-350 sqft/ton) and have also observed discrepancies compared to the hourly "Cooling:Electricity" results.
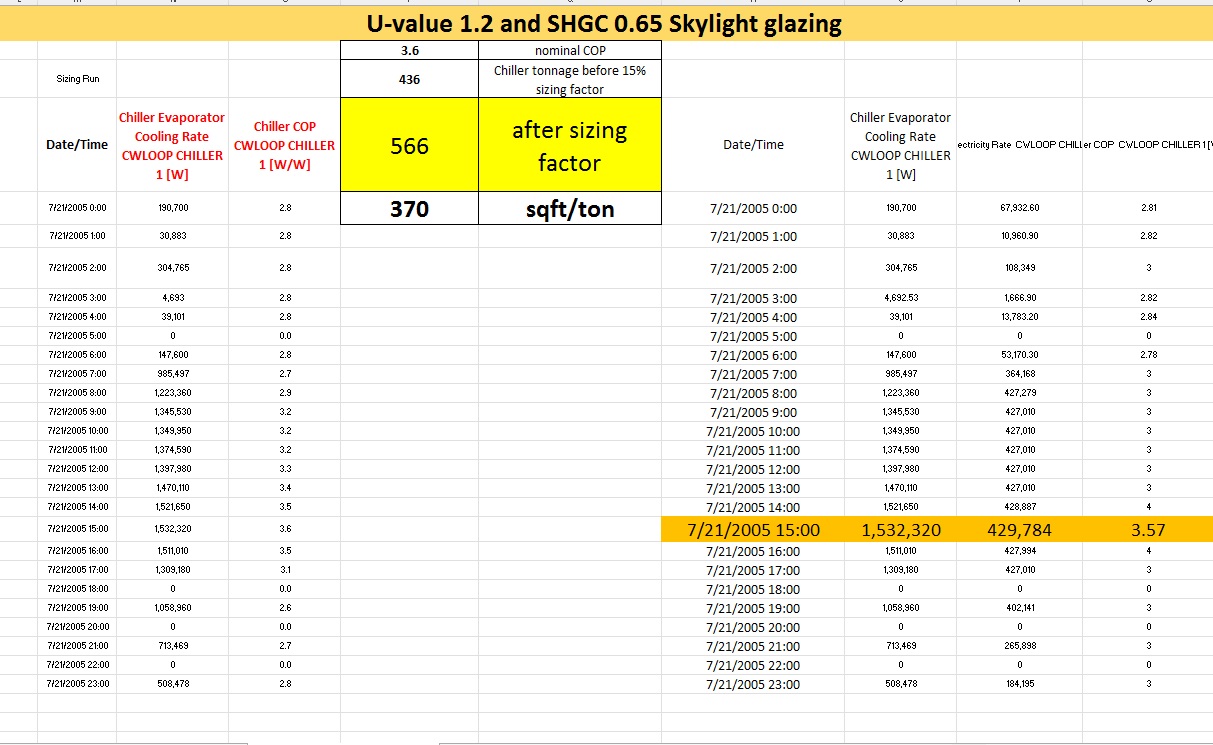
For sanity check comparing to the equipment sizing report I have extracted the hourly "Cooling:Electricity" meter from the eso file and looked at the peak value (in Joules), converted it back to kBtu electricity used to run the chiller and have back-calculated the peak chiller tonnage with the reference nominal chiller COP of 6 which is in the idf. The full set of data and some screenshots of relevant idf sections are also attached in [this excel sheet] for more (https://cannondesign.box.com/s/dz32wjv9klhsvr2dc1c77zgrkj2bnzpj). Also a link to the idf file.
What I don't understand is:
Why is the reported chiller size on the equipment summary table so much higher than peak observed in the hourly results?
I do have a 1.15 cooling sizing factor which should explain the difference between the AHU cooling coil total caps and total chiller cap. I also notice a large difference between the cooling coil "Design Coil Load [Btu/h]" and "Nominal Total Capacity [Btu/h]" which I can't explain
Is it possible that the chiller curves are what messing my calculations up from the hourly results to sizing?
Last but not least, perhaps a suggestion for the E+ development team is to build in more typical sizing benchmark checks and balances in these E+ reports similar to what Trace 700 has pioneered (sqft/ton etc.) that many designers are used to seeing and checking. Many software developers have taken it upon themselves to mimic these types of reports but perhaps the E+ development team can connect the dots in generic sizing reports as well to avoid these types of consulting led checks and balances?
I have done a cursory read through the recent and past bug history on the github here, here and here as it relates to cooling and chillers and I am not sure if there is more too it.


