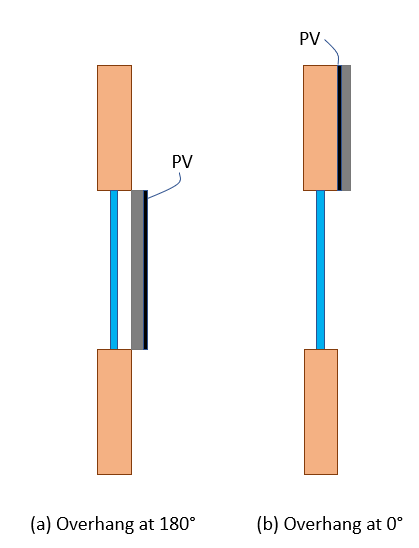
We are evaluating the performance of dynamic PV-integrated overhangs for the medium sized office building using EnergyPlus. It seems there is an issue when modeling the PV-integrated overhangs at extreme positions, i.e., 1) the windows are completely blocked by the overhangs (Figure a) and 2) the windows are completely unblocked (Figure b) as shown in the illustration below. There is an issue with the energy use results for the completely blocked windows scenario and with PV power output for the unblocked windows scenario.
It is expected that cooling energy reduces as we further block the windows. Energyplus results show that cooling energy decreases with the increase of tilt angle from 0deg to 160deg after which numbers are increasing. It is also expected that a PV-integrated overhang at 0deg would not generate any electricity since PV is totally facing the wall but EnergyPlus shows that PV is generating a considerable amount of electricity.
When visualizing these extreme positions in SketchUp, it looks like the overhang actually overlaps with the wall so I think this could be a modeling issue? Can anyone confirm this?