
Hello, I was wondering if anyone would know how to generate the charts that follow in the Openstudio's results as shown below:
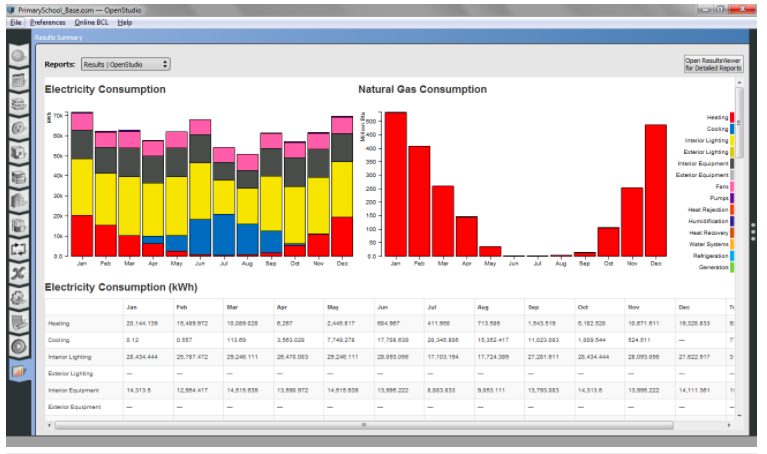
I have been able to generate some data however it only comes in the form of discrete values such as site and source energy (generated as energy plus Results) as opposed to showing the monthly fluctuating electrical consumption and so forth. Additionally is it possible to generate monthly graphs such as these outlining the heating and cooling loads experienced?
Any help would be greatly appreciated.


