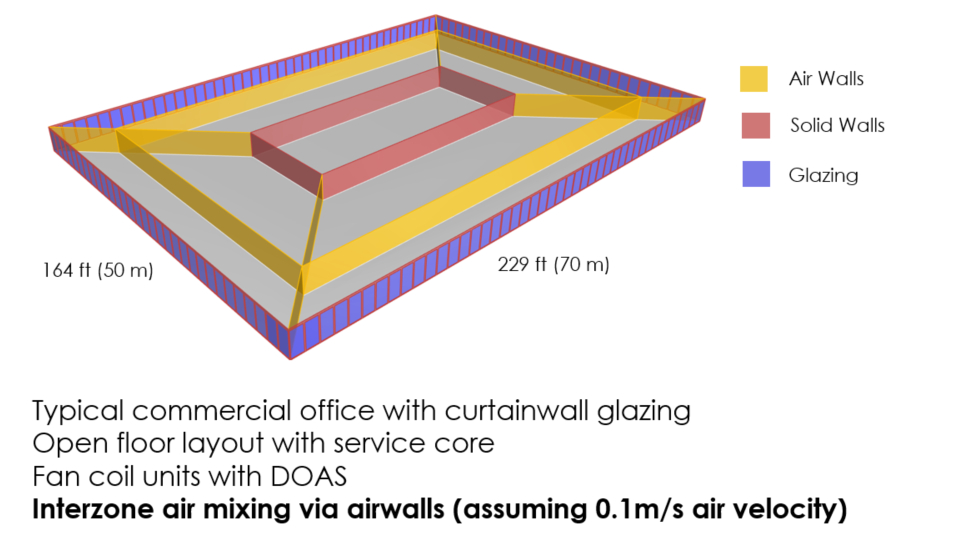
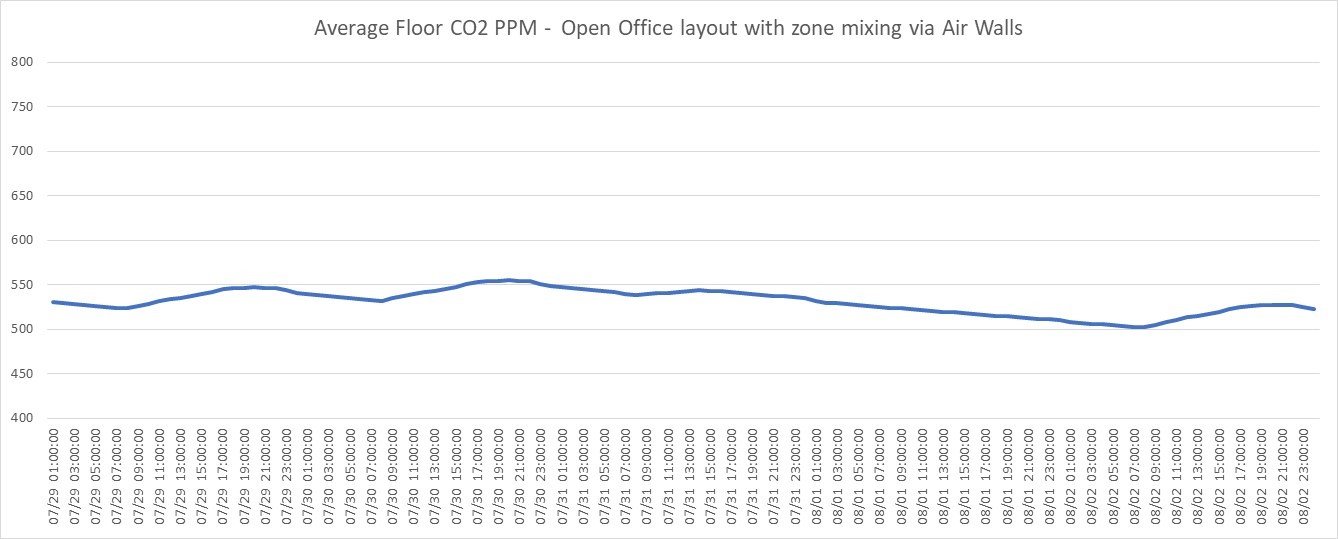
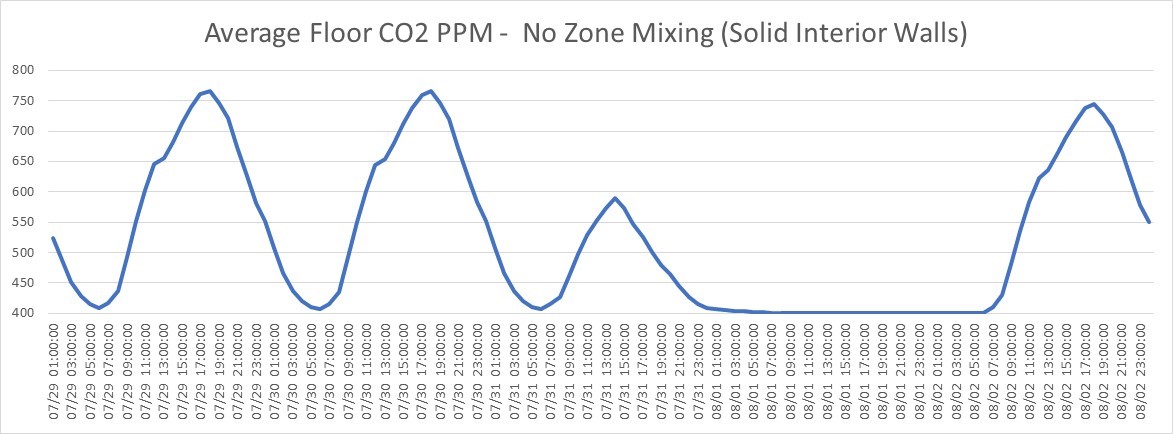
I am tracking is indoor CO2 for a project using E+. The model is one floor with air walls ( with interzone air mixing) and one solid wall core. The OA is 17 cfm/person. The outdoor CO2 is a fixed 400ppm. What I am observing is that when I measure the average CO2 in the office I get a pretty steady rate between 525 to 550 ppm (graph below). What’s strange is that the PPM values never gets close to 400 even when there is no occupancy at night or on Sunday (08/01). Now when rerun the same model but with no zone mixing I get a very different ppm graph never reaches steady state but keeps rising till the end of the day around 8 pm (end of occupancy) and then drops. The values now drop to 400 ppm when unoccupied and that makes sense to me. My question is why would zone mixing (or not mixing) affect the floor average CO2 PPM since the CO2 generation is the same and the OA ventilation is the same. Which one is correct ? I think it’s the second graph but sure what’s going in the first graph. Appreciate any insights.