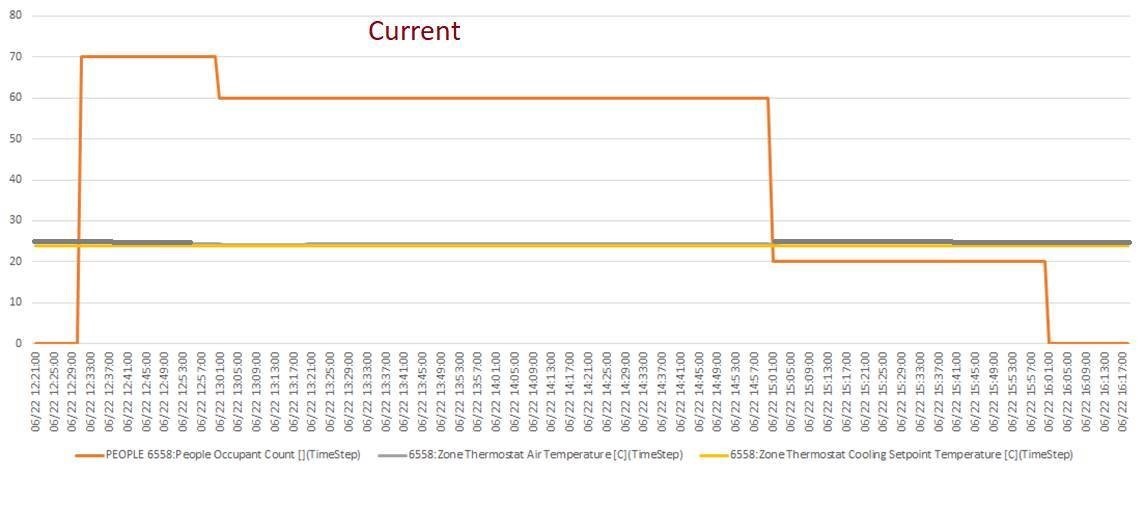
Implemented a sample building in EnergyPlus to analyze the impact of occupancy on zone temperature. The metabolic rate is set as 500 W/person. When certain number of people enters a particular zone, the zone temperature is not rising and when they leave the zone, temperature is not lowering. The plot is given below:
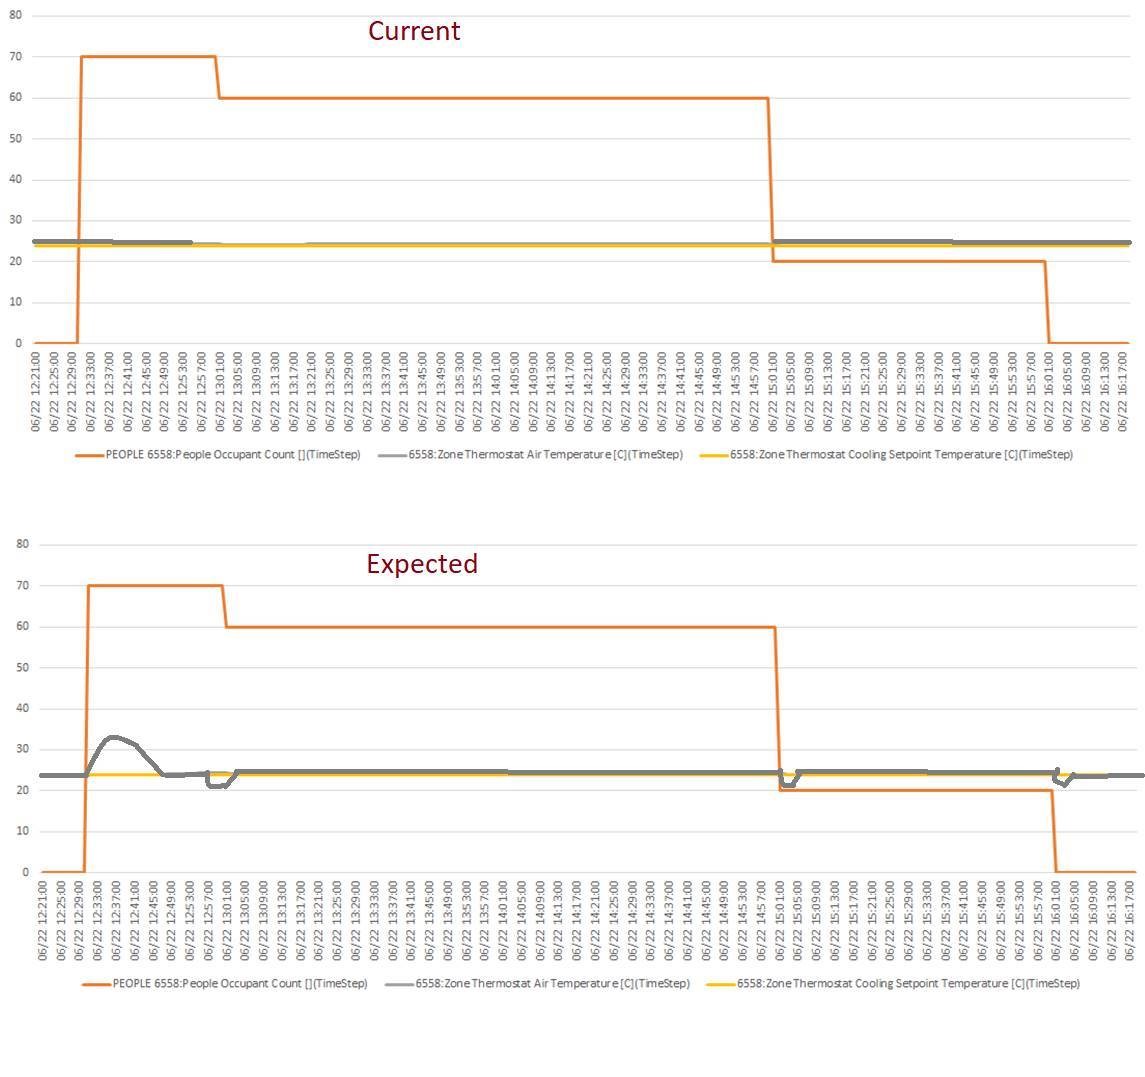
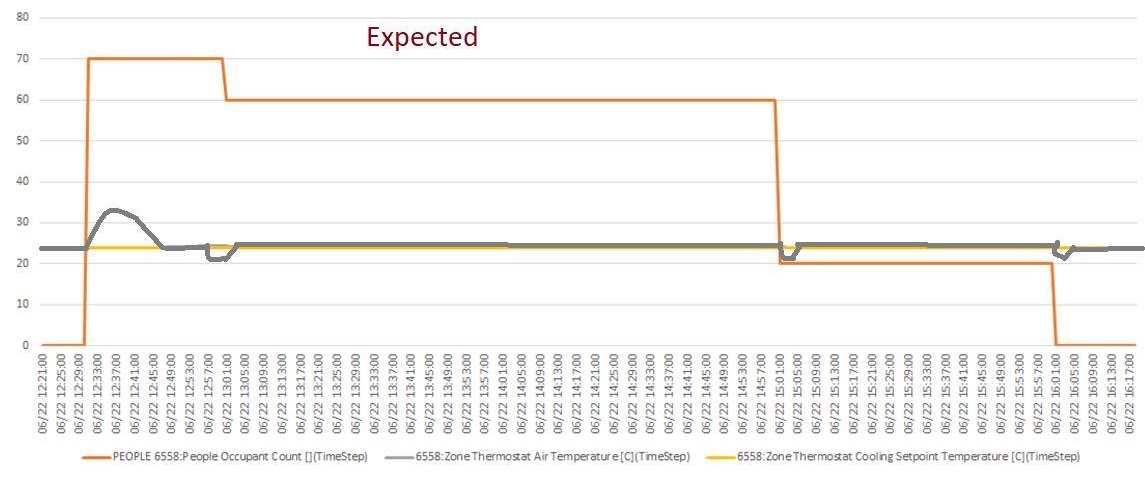
I am looking for a model like the below one where there are fluctuations in zone temperature upon occupancy. The drawing may not be the exact representatives but to just show the behavior.

Could anyone help me to achieve this behavior in EnergyPlus