
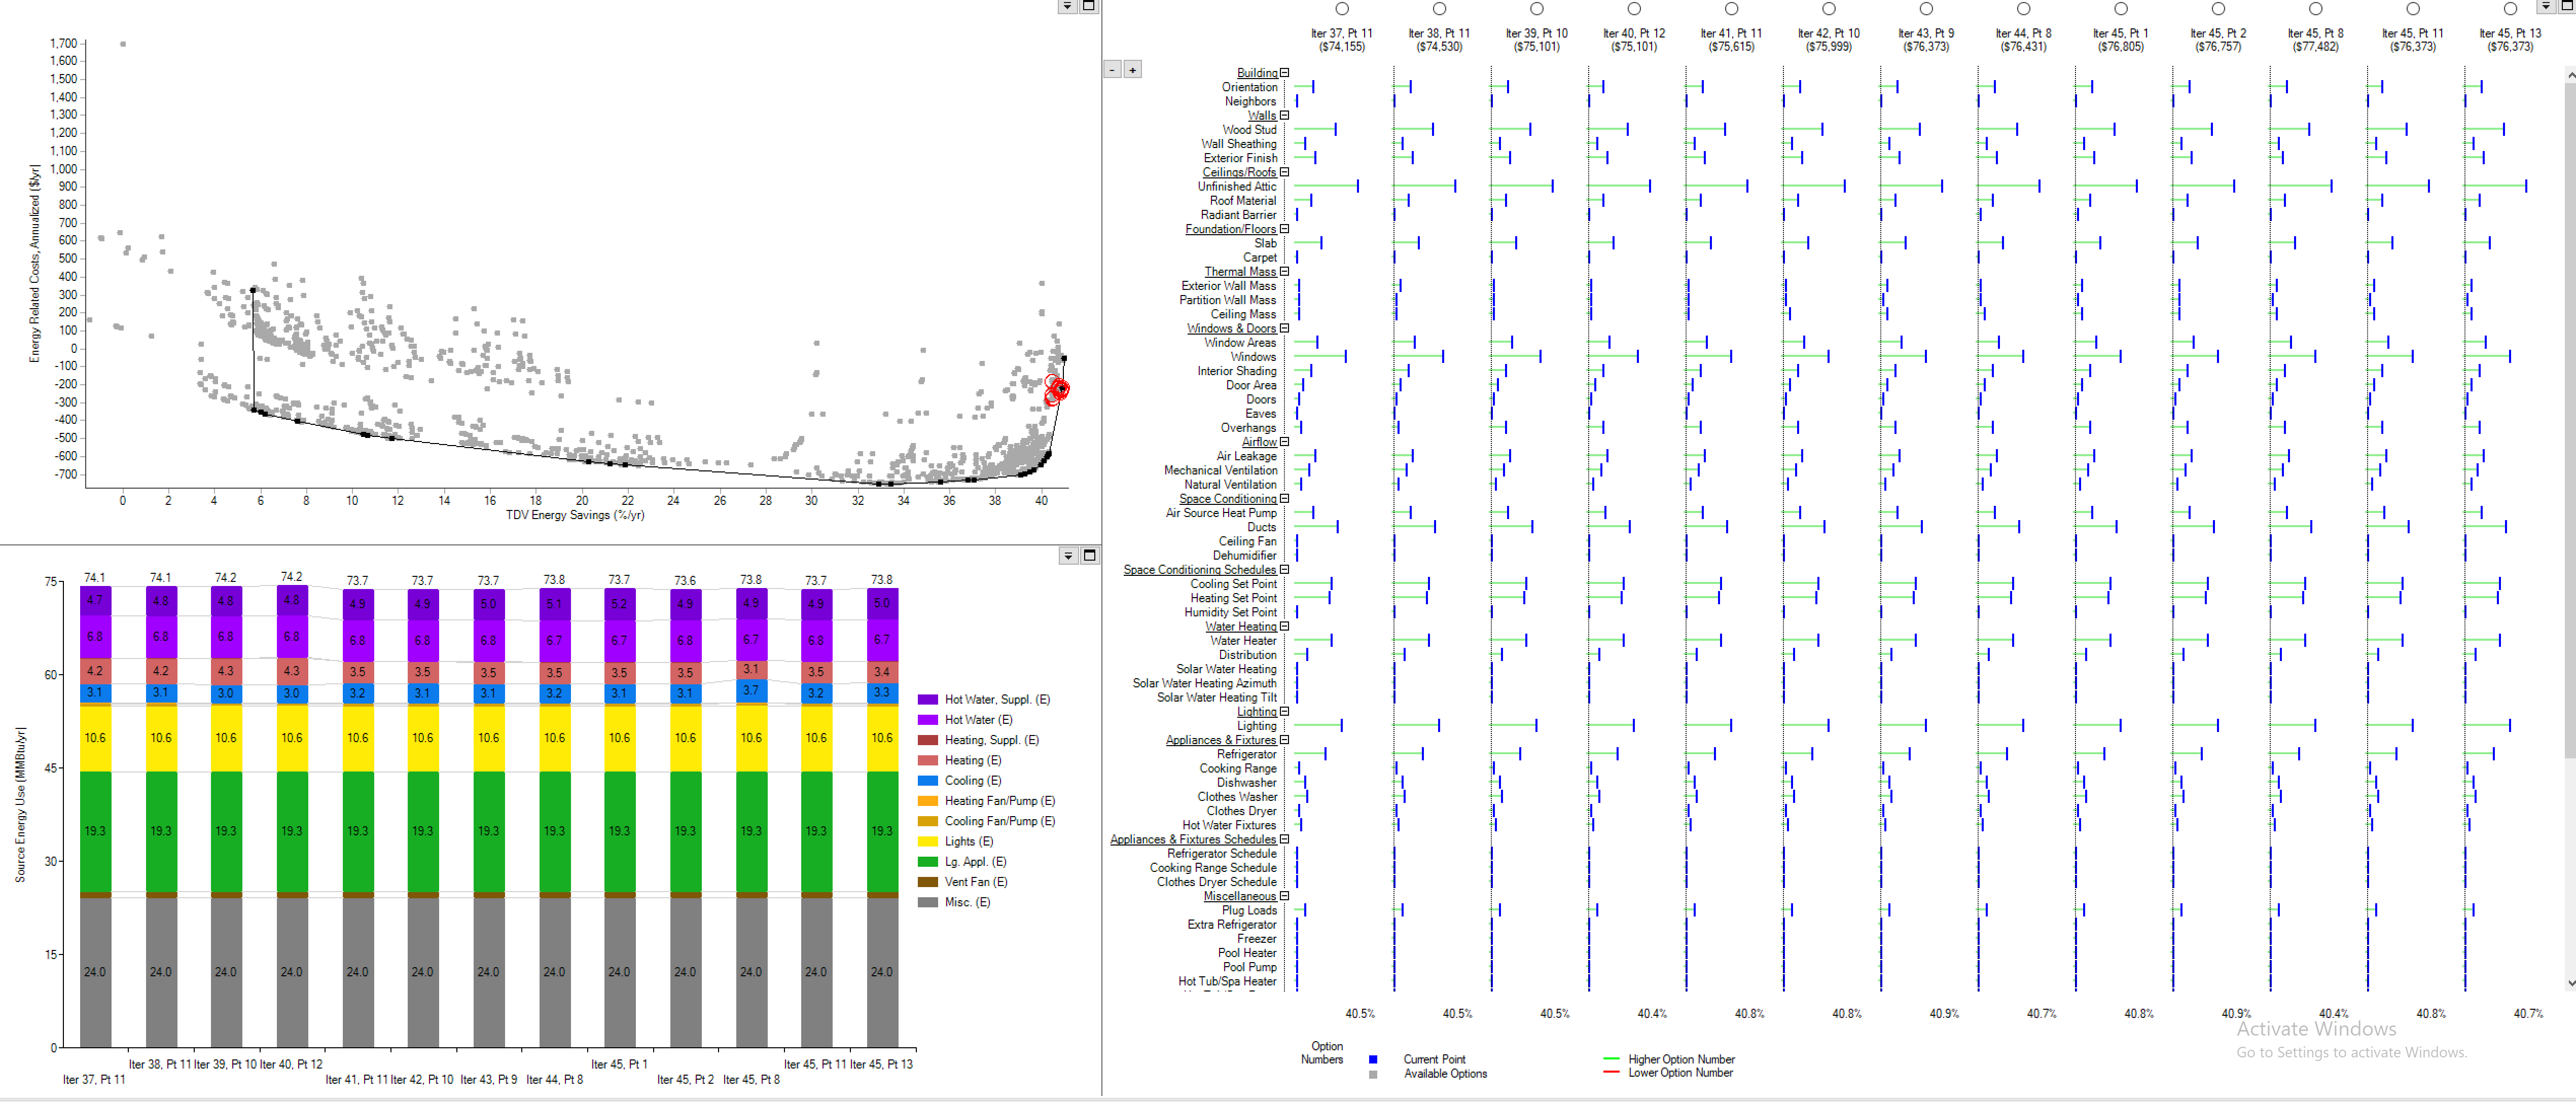
In BEOpt, I ran a SFam 2019 Title 24 baseline scenario for Bakersfield, CA, & then ran Optimization on various features except PV (that is the final step). See attached screen shot.
The results seem to be in the right direction, but I am not sure of the magnitude:
-- $700/yr Energy Related Cost savings (annualized)
-- over 40% TDV Savings (%/yr).
-- The lowest absolute numbers for TDV are < 100 MMBTU/yr (max on curve is 160), and < 75 MMBtu/yr for Source E (max on curve is > 110).
-- Both of the ERC and TDV savings seem high, especially the 2nd #. They may be higher than my earlier runs with fewer options, due to substantial synergies. I have seen Passive House designs that can go way beyond Title 24 minimums (to near zero electricity), suggesting that T. 24 sets a pretty low bar.
1) Do these numbers look reasonable, and is there an easy way to check that?
2) Re: the reference point, I need to confirm what point on the chart is the reference or starting point (Title 24 baseline). Is it the top left point at the beginning of the optimization curve?
TIA, Tom
Attached screen shot (please contact me if this does not work) : C:\fakepath\BFC Sfam Optimized no PV 2019-08-21 16.33.09.png


