
Hi,
In a single air cooled chiller project, REF capacity is 320.7 KW at 35 C outdoor temp, a set of data was used to produce curves to predict chiller power consumption.
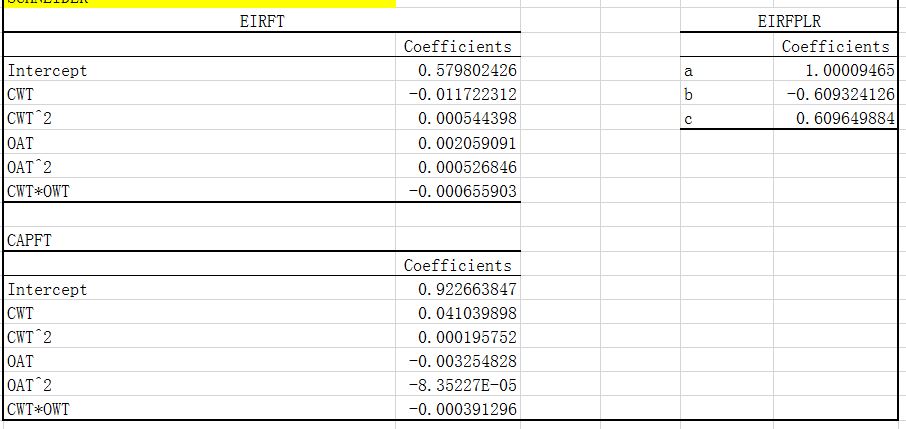
The curve coefficients are (for SI):
Using excel, hourly data was manually calculated, at the same time EP simulation was done using same data, checking the variable reports, the hourly EIRFT, EIRFPL, CAPFT and PL are the same:
Variable report from EP C:\fakepath\ENERGYPLUS REPORT.JPG
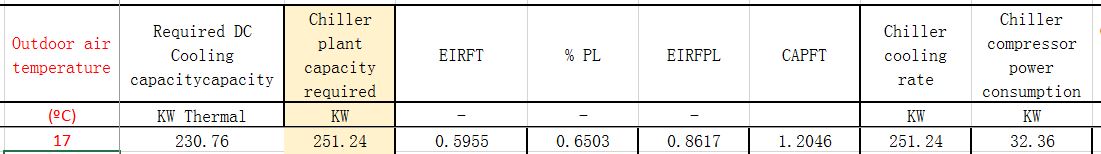
Manual calculation C:\fakepath\MANUALLY CALCULATED.JPG
But when i compare the chiller compressor power there is a difference, for example at 17,2 C and 251.23 Kw of cooling requirement, the results are:
In EP result Chiller compressor power is 49.8 Kw
In EXCEL result Chiller compressor power is 32.4 Kw
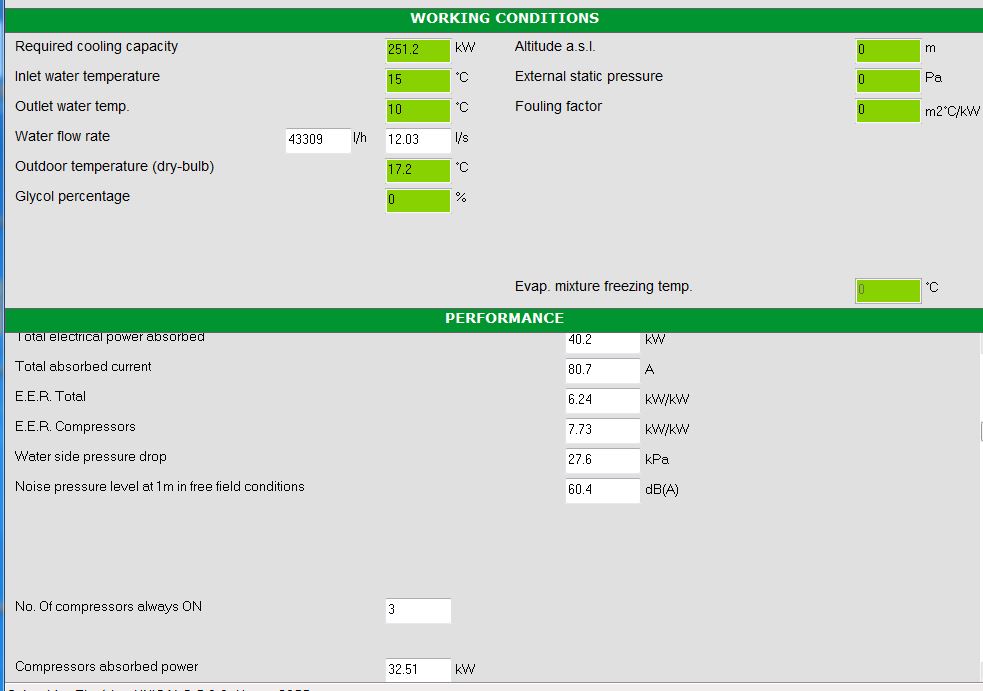
In Chiller data report (from manufacturer) compressor power is 32.5 at partial load (similar to 32.4 Kw in EXCEL result) C:\fakepath\CHILLER PERFORMANCEM320KW.JPG
When i check i notice that the 49.8 Kw in EP report is for a chiller that produce the maximum cooling capacity at corrected conditions but seems is not reduced by PLR because now is producing partial cooling and not total cooling, if you multiply 49.8 * 0.65 (the actual PLR) the result is 32.39 Similar to Excel manual evaluation.
For sure the EP COP is 5 and according Manufacturer data the COP should be 7.7 at this partial load condition similar to manual calculation.
Can some body explain why the compressor power results in EP is like this (higher) and not reduced by the PLR? this difference produce high annual energy consumption than calculated manually.
Thanks.


