Can someone explain the meaning of the percentages shown at the bottom of every iteration during a optimization simulation?
Thanks.
| | 1 | initial version |
Can someone explain the meaning of the percentages shown at the bottom of every iteration during a optimization simulation?
Thanks.
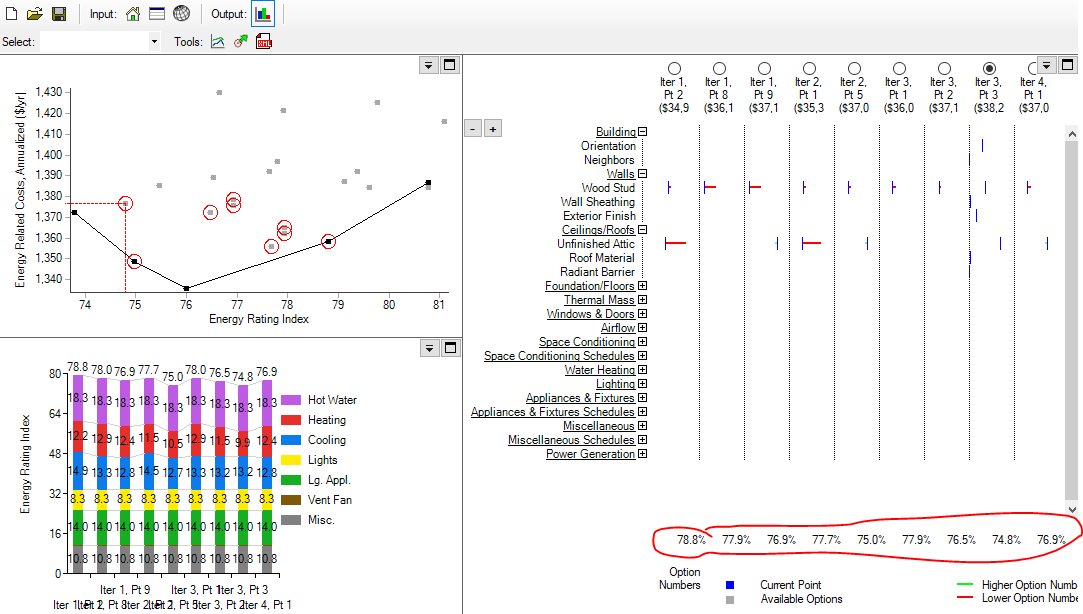
Can someone explain the meaning of the percentages shown at the bottom of every iteration during a optimization simulation?
Thanks.C:\fakepath\screenshot.PNG
| | 3 | None |
Can someone explain the meaning of the percentages shown at the bottom of every iteration during a optimization simulation?
Thanks.C:\fakepath\screenshot.PNG