Question-and-Answer Resource for the Building Energy Modeling Community
Get started with the Help page
Ask Your Question
2

percentages at bottom of options window with optimization setting

asked 2019-02-04 06:13:41 -0500

gwisejr's avatar

updated 2019-02-04 10:58:48 -0500

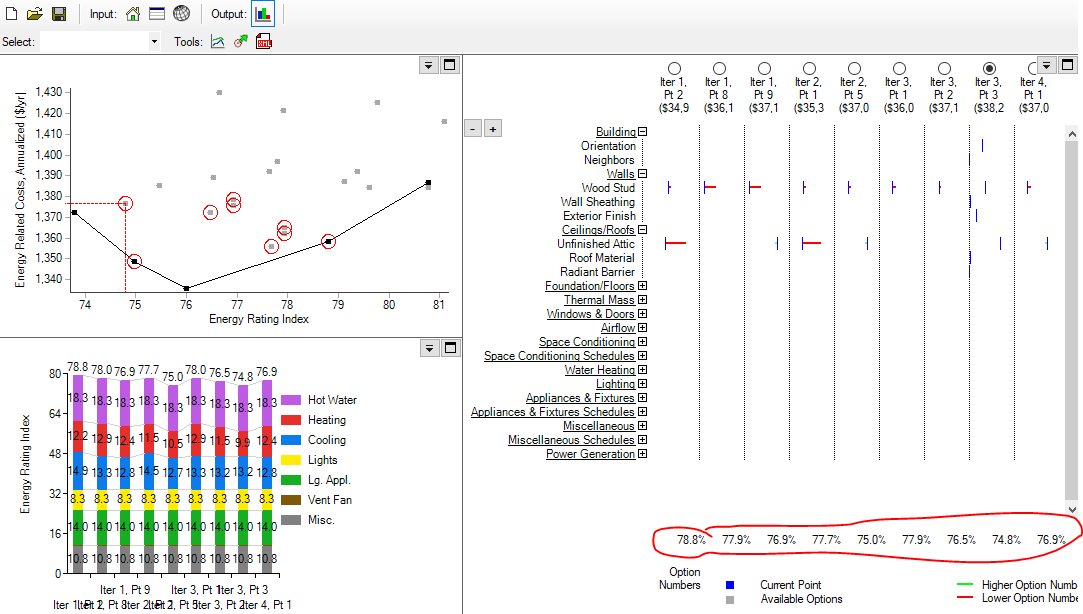
Can someone explain the meaning of the percentages shown at the bottom of every iteration during a optimization simulation?

Thanks.

image description

edit retag flag offensive close merge delete

Comments

Which percentages are you referring to? Can you provide a screenshot?

shorowit's avatar shorowit  ( 2019-02-04 09:30:30 -0500 )edit

ok, i uploaded a screenshoot. thanks..

gwisejr's avatar gwisejr  ( 2019-02-04 10:36:47 -0500 )edit

1 Answer

Sort by ยป oldest newest most voted
1

answered 2019-02-04 11:00:39 -0500

updated 2019-02-04 13:09:09 -0500

The highlighted values correspond to x-axis values for the selected points in the Cost/Energy graph (the top-left graph). So in your case, they correspond to Energy Rating Index values.

edit flag offensive delete link more

Your Answer

Please start posting anonymously - your entry will be published after you log in or create a new account.

Add Answer

Careers

Question Tools

1 follower

Stats

Asked: 2019-02-04 06:13:41 -0500

Seen: 68 times

Last updated: Feb 04 '19