
Hi all,
I am applying the cibse TM52 for overheating assessment. I am studying the evolution of the operative temperature throughout the cooling season and everything seems reasonable except one aspect.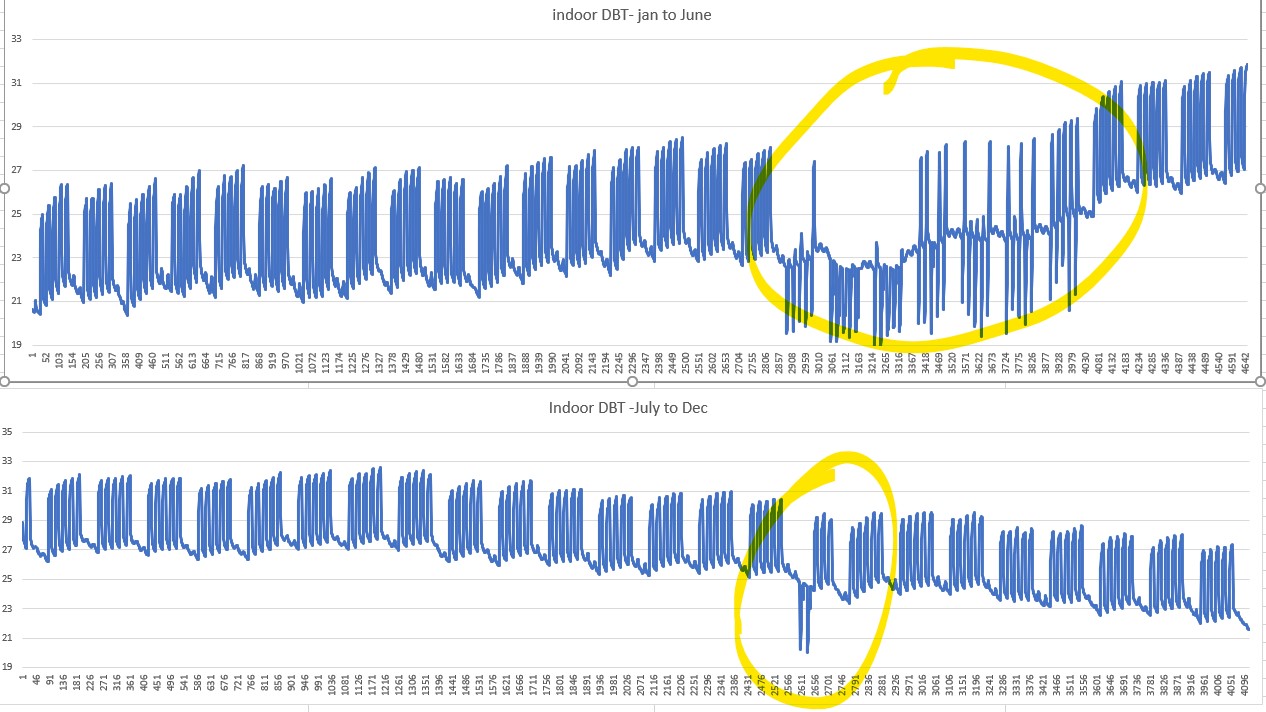
I am using EPlus 8.9 and the occupancy profile is the standard one provided by ISO 13790, for non residential buildings. Here you can see the evolution of the indoor temperature(from my calcs is the one that affects the op.temp the most.). there is a window stack schedule to mimic the user behavior in opening the window (may-oct), during occupancy hours (mon-friday 7-17).
The yellow circle above occurs in may-june and the last is at the end of october. I am trying to figure out why i am having this results compared to the other months when the internal loads don't change neither in intensity nor in schedule.
Do you think it may be affected by my window stack schedule? if so, it is strange because i don't know why in the other week of the year the indoor dbt profile doesn't change that much .
Best
