_9Seeaet.png "carlobianchi89")
I am having hard times with the way EP treats incoming solar radiation. I created a simple test case: a cubic building, perfectly aligned on the north direction, only red-brick, no surrounding objects, ideal loads, constant internal room temperature, constant air temperature, constant wind speed, constant humidity. The only thing that varies is the incoming solar radiation. I used a model to determine the clear-sky radiation in my location, the TMY3 may contain some weird effects due to the clouds' presence. I set EP to output "Surface Outside Face Incident Solar Radiation Rate per Area [W/m2]" on each surface. I checked out January 1 (the first 24h of the year) and something weird happens.
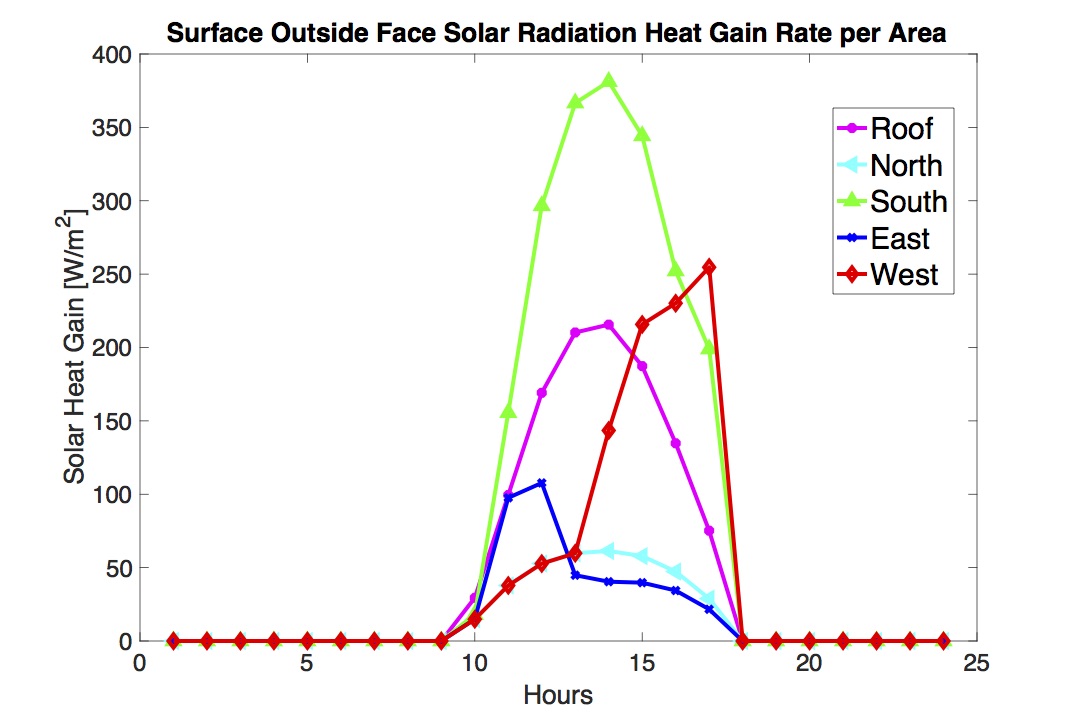
All the surfaces except west and east show a symmetrical collection of radiation during the day, as expected. You can see that in the picture attached: C:\fakepath\SolRad.jpg
East and West are not supposed to be symmetric, they receive direct radiation in different parts of the day. However, the peak of incoming radiation for the west side is much higher than the peak for the east side.
How is it possible? What possibly can alter the collection of solar radiation on those 2 surfaces?
Note the material of each surface is the same. Attached you can find the plot for January 1, I can provide the .idf and the .epw file if you want to replicate the analysis.


