

I'm having trouble understanding how IES normalizes its chiller performance curves. Here is the window for the EIRfPLR&dT curve for a generic centrifugal chiller with VSD (as a side note- does anyone know why just the last coefficient is different than the corresponding DOE2.2 curve?):
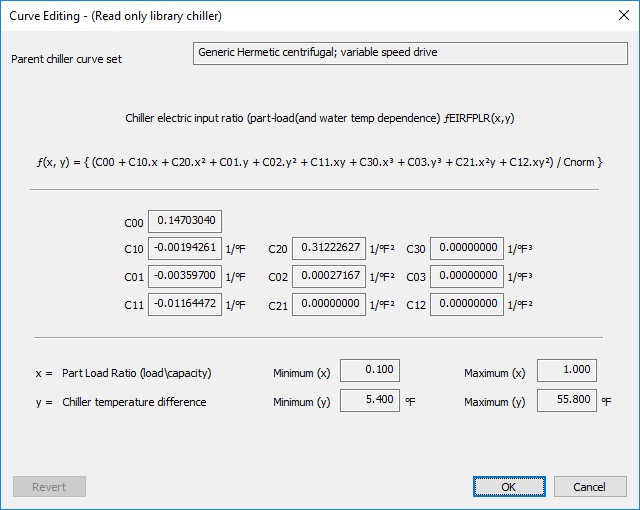
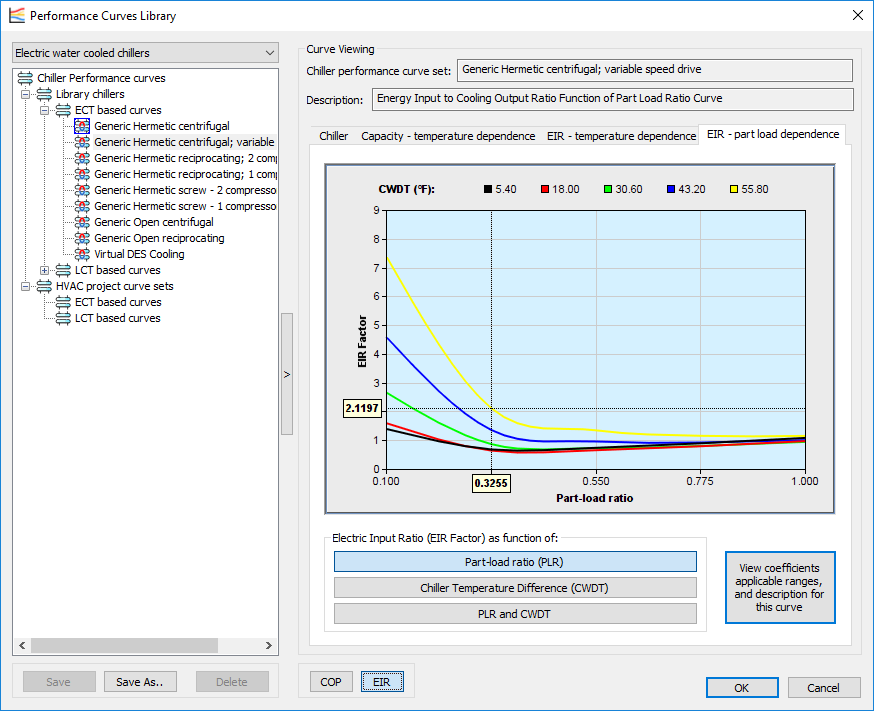
Notice the "/Cnorm}" part of the equation. When I do my own spreadsheet calculations to determine the distribution of this curve over various PLRs and CWDTs, I can't seem to ever determine how IES gets to its "EIR Factors" shown in the image below:
In my hand calculation, I calculated the curves based on the same equation and coefficients as in IES, and divided each data point by the PLR.
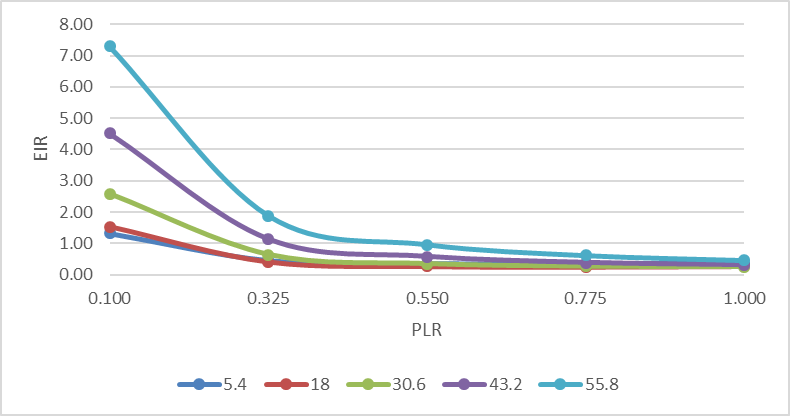
This is close, but isn't quite there yet. IES's curve shifts up towards 1 at the tail end, insted of down like mine does. IES's documentation says that Cnorm is adjusted so that the curve yields "1" at the rated conditions, which in this case would be a PLR of 1 and CWDT of 41F. However, when I try to adjust the curves in this way, I instead get very high values at low PLRs due to dividing by a Cnorm that is less than 1:
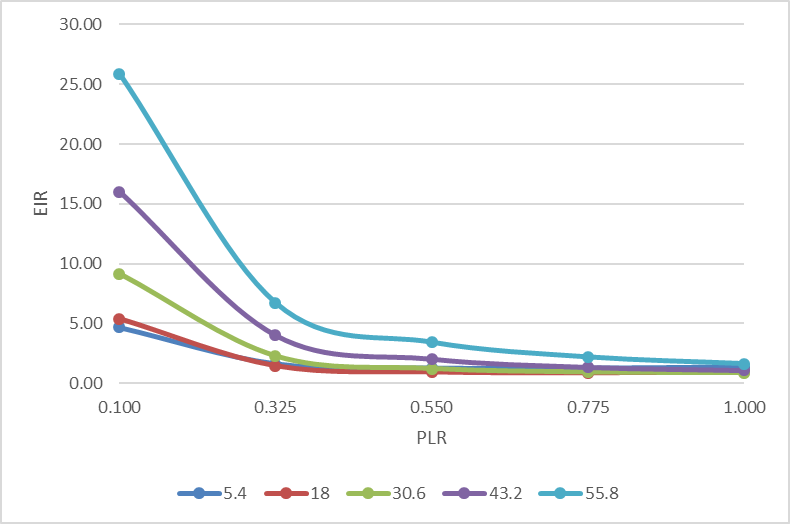
Any ideas how how IES calculates it's "Cnorm"?
