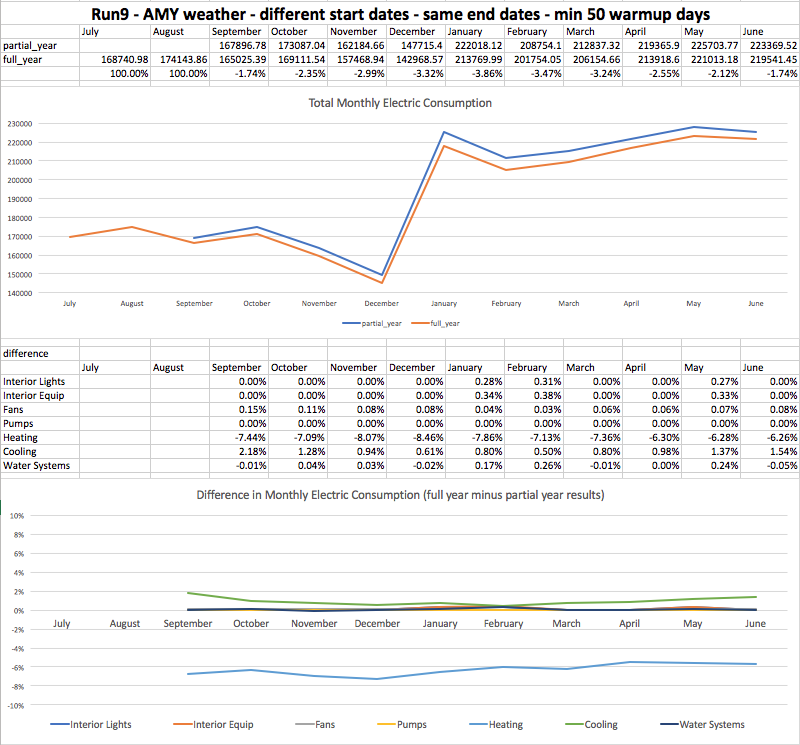
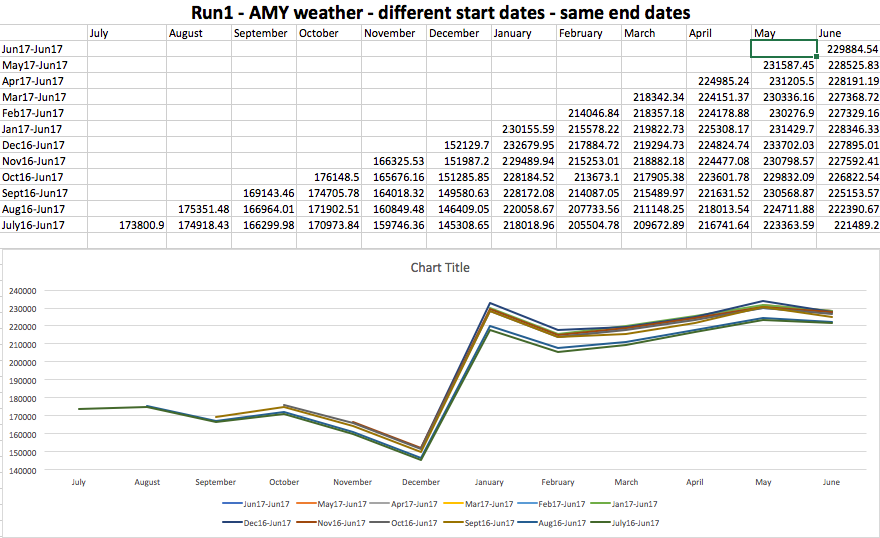
For the attached model, differences in monthly total electric energy consumption were observed when the start date of the simulation was changed. For the plot below, the end date (and everything else) were held constant.
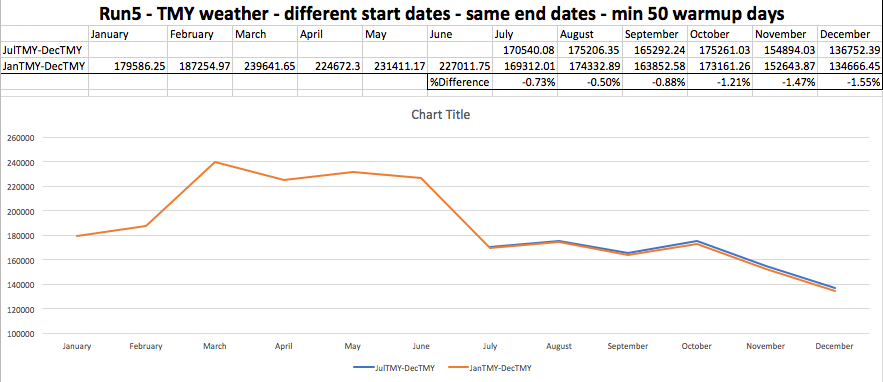
More pronounced differences between runs (w/ different start dates and the same end date) were observed when AMY weather was utilized.
Has anyone experienced this sensitivity before? I also increased the minimum # of warmup days to 200; no decrease in sensitivity to start date was observed. From the *.eio file, it was confirmed that the autosize results were the same regardless of start date.