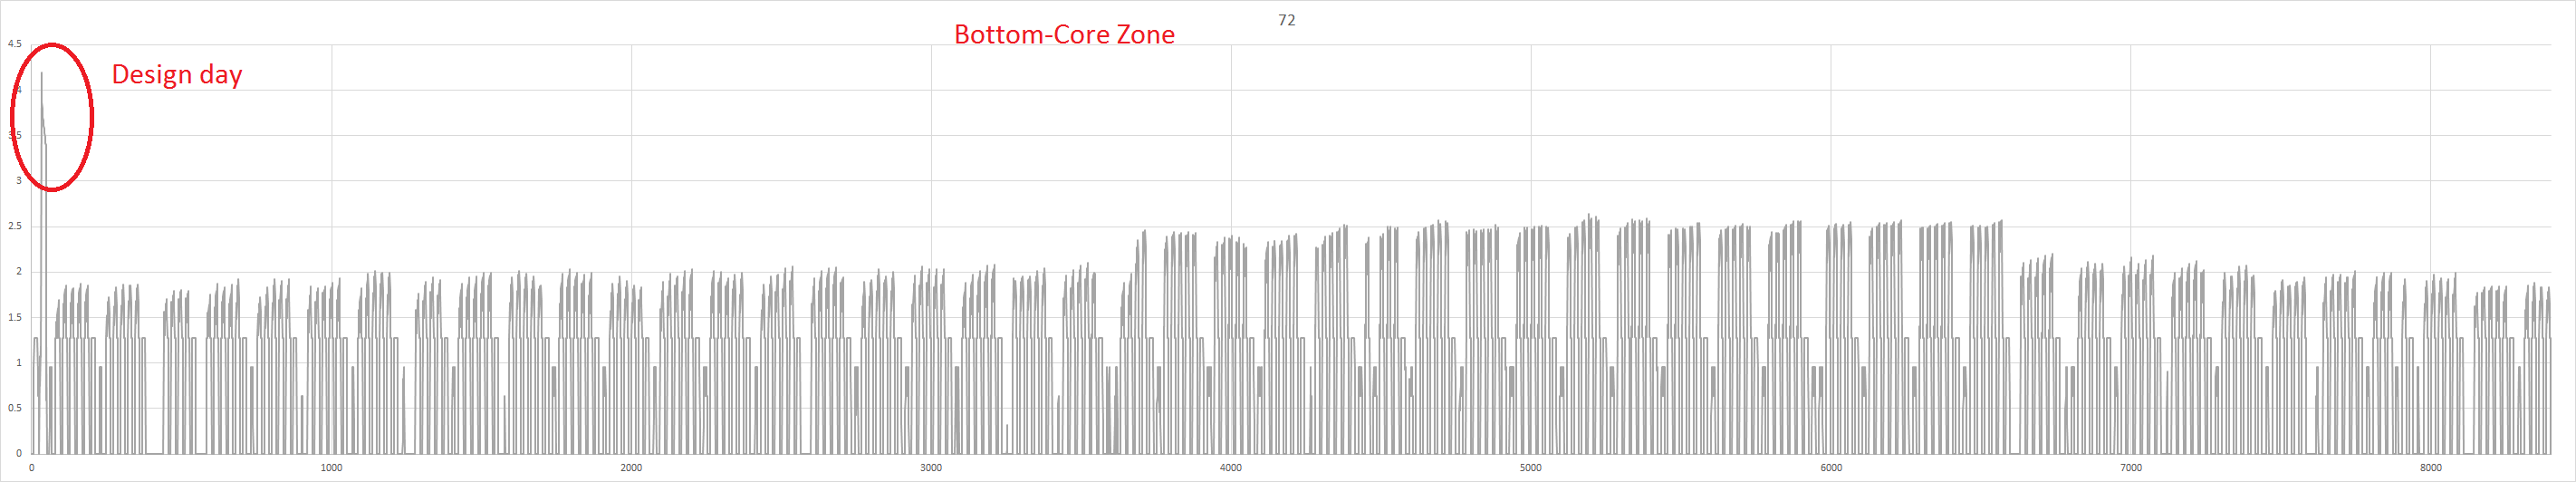
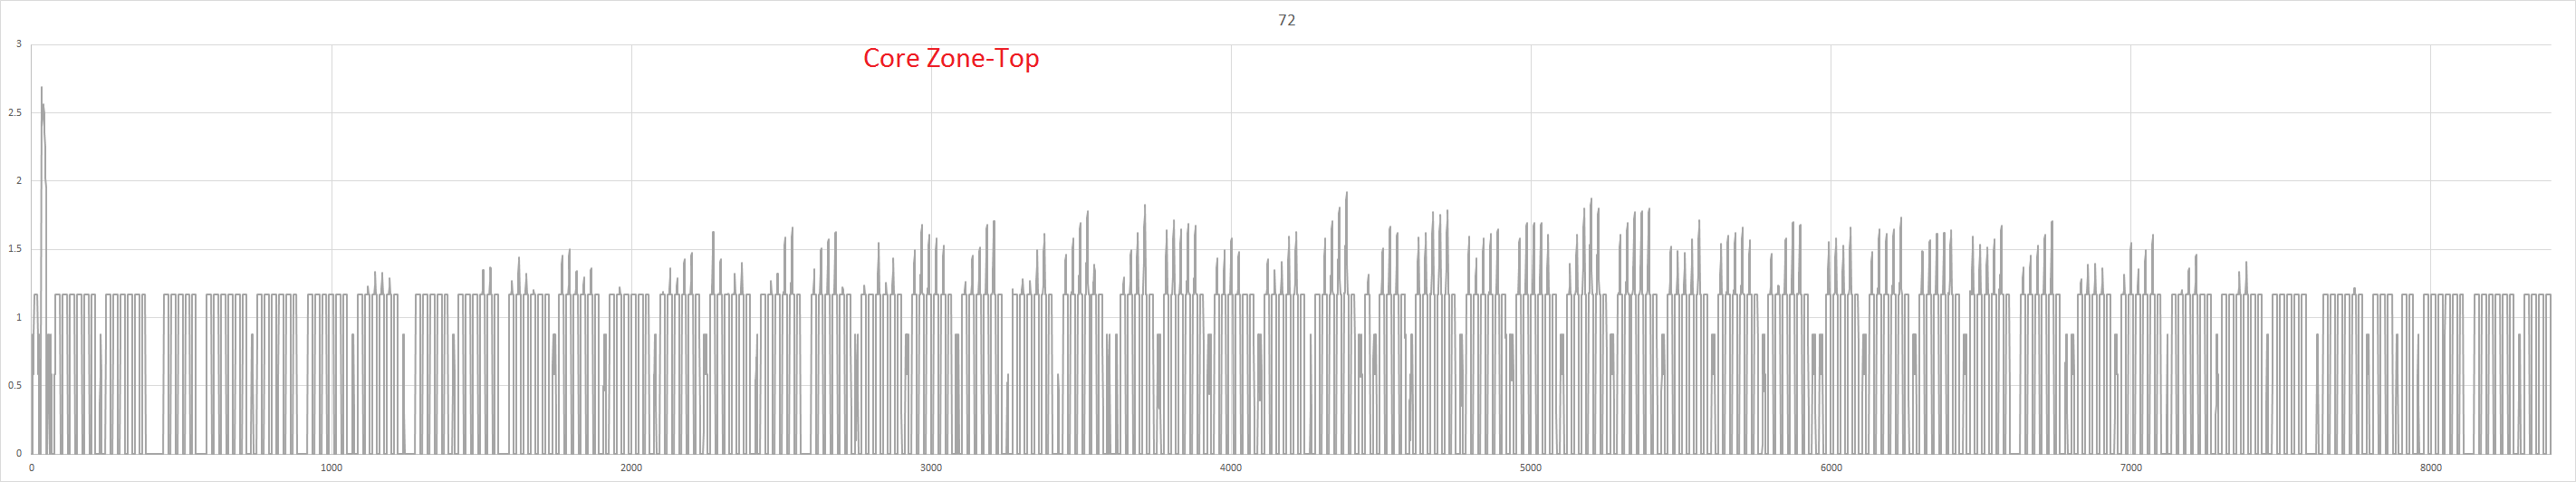
I am running the PNNL prototype models for medium size office buildings. For detailed simulation results, I exported hourly outputs/mass flow rates at each node.In the csv file the airflow rates for the design day are higher than the simulation day results. I understand there can be differences due to the difference in weather data on design day and any other simulation day. When I compare the maximum airflow rates for design days and rest 365 simulation days for each zone the max airflow for core zones are as much as 80% higher than max airflow for the simulation days. For example, for one of the core zones the max airflow for design days is 2.8 m3/s (~6000 cfm) and max airflow for the rest of the year is 1.56 m3/s (~3300 cfm).
As I understand the design days are used to calculate the autosize variables. If the design days are predicting higher mass flow rates the equipment size will also be higher for rest of the year's simulations.
Due to this the system is getting oversized and the 30% min airflow for the VAV at that zone is almost 55% of the max airflow (yearly max). This will lead to calculating excessive amount of reheat energy.
For perimeter zones, the max design day airflow are 0.9 to 1.1 times of the max yearly airflow. However, for core zones, the design day max airflows are between 40 to 80% higher than max airflow throughout the year for San Francisco file. Are these expected results for core zones? Is there any variable that might cause this issue? Is this due to the thermal inertia?
EnergyPlus version: 8.6