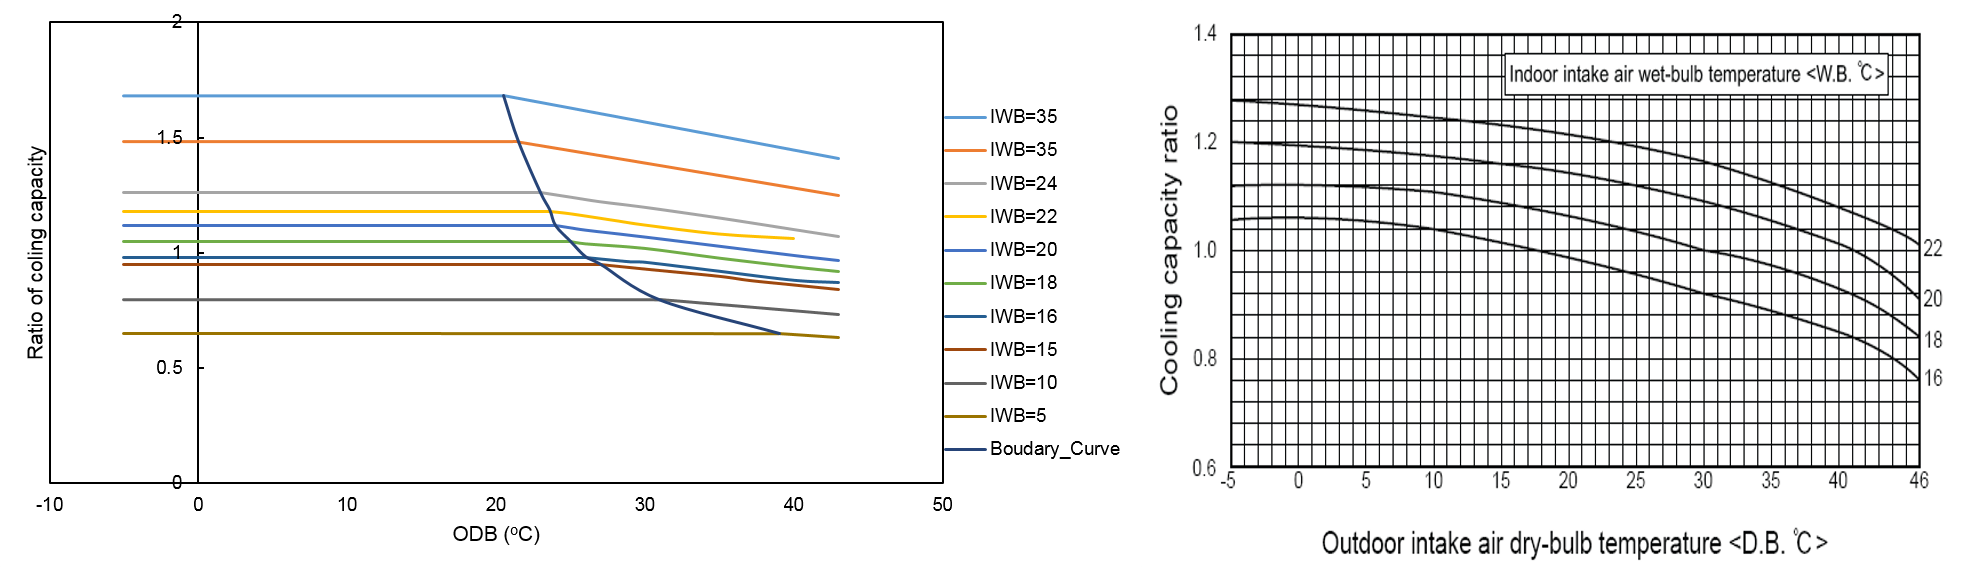
I have developed a performance curve for a VRF system (Left-hand side figure). My questions are;
- In order to plot boundary curve (Cubic) I used Low temperature region regression equation to calculate CapFT from ODB and then plotted it as shown in the Left-hand side figure, this clearly gives a better fit. I am wondering, is this the right way or I am missing something?
- If the above is correct and as I used low temperature region regression curve then what about when the low curves are not flat (e.g.Right-hand figure below)? In this case is it better to use table method and do we still need to do extrapolation? If we still need extrapolation for other temperature ranges then how to find the point between low and high regions?
- What if pipe correction and Part-load performance datasets/curves are not available, is there a workaround to model VRF systems in this case?