Question-and-Answer Resource for the Building Energy Modeling Community
Get started with the Help page
Ask Your Question

Revision history [back]

Source and Derivation of Pump Performance Curves

A previous post helped clarify the origin of fan performance curves.

I'm also curious about the source and derivation of pump performance curves.

The image below is from the ANSI/ASHRAE/IES Standard 90.1-2022 Performance Rating Method Reference Manual.
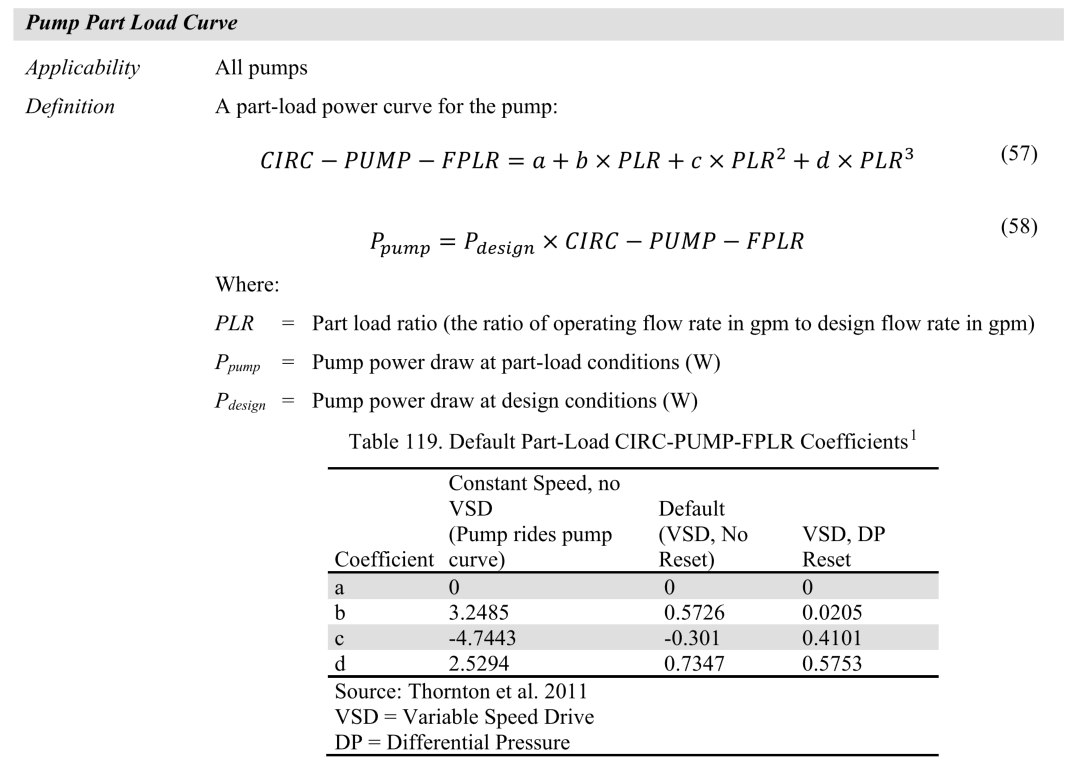
image description

  1. Constant-speed pump riding the pump curve: (0, 3.2485, -4.7443, 2.5294)
  2. Variable-speed pump without differential-pressure reset: (0, 0.5726, -0.3010, 0.7347)
  3. Variable-speed pump with differential-pressure reset: (0, 0.0205, 0.4101, 0.5753)

These coefficients are published in Table 5.21 of Achieving the 30% Goal: Energy and Cost Savings Analysis of ASHRAE Standard 90.1-2010 (Thornton et al., 2011), which only states that PNNL developed the three curves. I have not been able to trace the underlying data or derivation any further.

Does anyone know how these coefficients were originally derived?

Source and Derivation of Pump Performance Curves

A previous post helped clarify the origin of fan performance curves.

I'm also curious about the source and derivation of pump performance curves.

The image below is from the ANSI/ASHRAE/IES Standard 90.1-2022 Performance Rating Method Reference Manual.

image description

  1. Constant-speed pump riding the pump curve: (0, 3.2485, -4.7443, 2.5294)
  2. Variable-speed pump without differential-pressure reset: (0, 0.5726, -0.3010, 0.7347)
  3. Variable-speed pump with differential-pressure reset: (0, 0.0205, 0.4101, 0.5753)

These coefficients are published in Table 5.21 of Achieving the 30% Goal: Energy and Cost Savings Analysis of ASHRAE Standard 90.1-2010 (Thornton et al., 2011), which only states that PNNL developed the three curves. I have not been able to trace the underlying data or derivation any further.

Does anyone know how these coefficients were originally derived?