unitary water-to-air heat pump capacity curve


In E+ Engineering Reference (e.g. v23.1.0), for Unitary Water-To-Air Heat pump, Coil:Cooling:WaterToAirHeatPump:EquationFit uses the reference and curve fit below to calculate Qtotal, Qsens and Powerc.
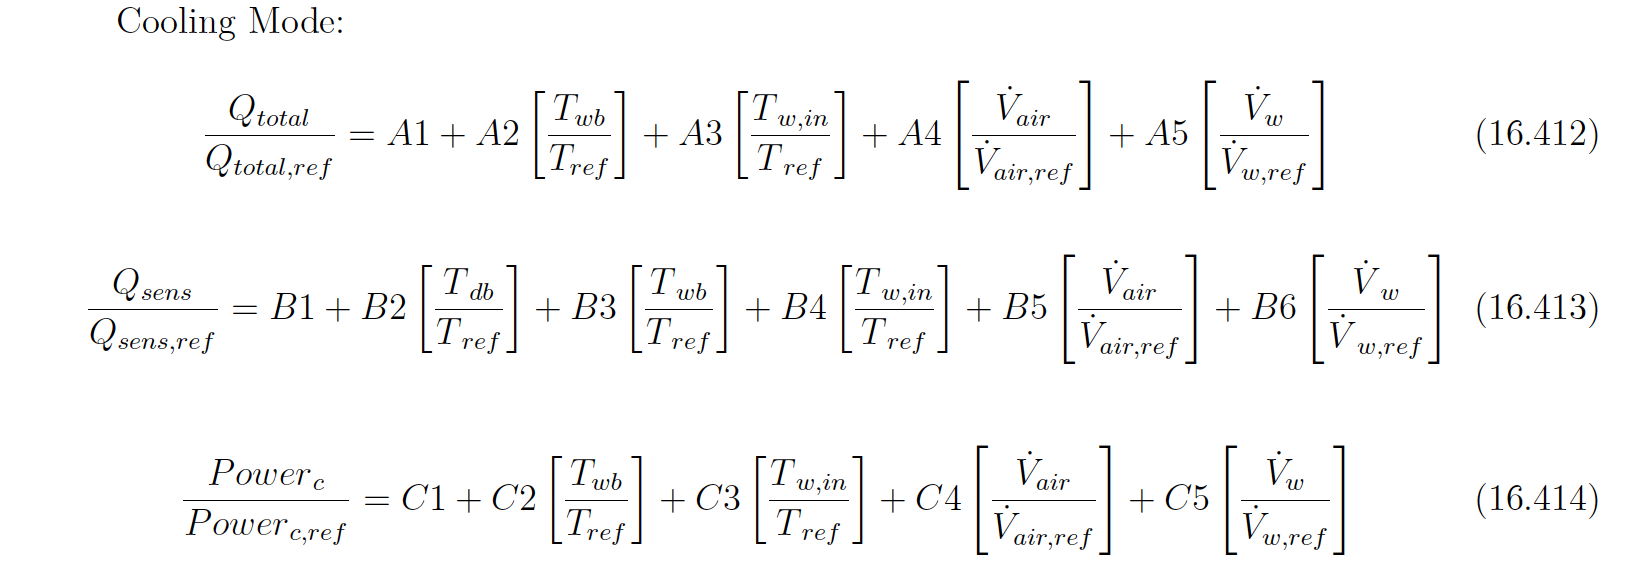
When I used the curves (A1 to A5) from one of the Resstock model to calculate the Qtotal, I found that the Qtotal/Qtotal,ref falls between 0.8 to 1.0, even when the Vw is 0, i.e. when there's no cooling load, based on hourly output.This makes me think whether Qtotal is the hourly cooling rate of the coil or something interim result that needs to be normalized based on part load first before calculating the hourly cooling rate.
Any thoughts?
Appended, the curve in my os model for cooling.
Curve:QuadLinear,
  ground source heat pump clg total cap curve, !- Name
  -1.57177156131221,                      !- Coefficient1 Constant
  4.60343712716819,                       !- Coefficient2 w
  -2.15976622898044,                      !- Coefficient3 x
  0.0590964827802021,                     !- Coefficient4 y
  0.0194696644460315,                     !- Coefficient5 z
  -100,                                   !- Minimum Value of w {BasedOnField A2}
  100,                                    !- Maximum Value of w {BasedOnField A2}
  -100,                                   !- Minimum Value of x {BasedOnField A3}
  100,                                    !- Maximum Value of x {BasedOnField A3}
  0,                                      !- Minimum Value of y {BasedOnField A4}
  100,                                    !- Maximum Value of y {BasedOnField A4}
  0,                                      !- Minimum Value of z {BasedOnField A5}
  100,                                    !- Maximum Value of z {BasedOnField A5}
  ,                                       !- Minimum Curve Output {BasedOnField A4}
  ,                                       !- Maximum Curve Output {BasedOnField A4}
  Dimensionless,                          !- Input Unit Type for w
  Dimensionless,                          !- Input Unit Type for x
  Dimensionless,                          !- Input Unit Type for y
  Dimensionless;                          !- Input Unit Type for z


@xchen can you include the text of the Qtotal/Qtotal,ref performance curve from Resstock? I'm guessing that the min & max limits of the curve output are set to 0.8 and 1.0, respectively.
@Aaron Boranian I added the curve from my model above. There does not seem to be a limit on the curve output.
@xchen sorry, can you include the text of this performance curve in the IDF generated from this ResStock OSM? There is a chance that the OSM => IDF translation process is setting the min/max curve output fields to 0.8 & 1.0, respectively.
In [WaterToAirHeatPumpSimple.cc] (https://github.com/NREL/EnergyPlus/bl...) Qtotal is modified by multiplying PartLoadRatio, maybe that's the reason?
@Aaron Boranian, I updated the curve input above.