Question-and-Answer Resource for the Building Energy Modeling Community
Get started with the Help page
Ask Your Question
1

How to model reasonable VRF EIRFPLR curve with insufficient data

asked 2023-01-22 14:42:29 -0500

Keigo's avatar

I referred to this great paper and customized VRF performance curves by regresson analysis.

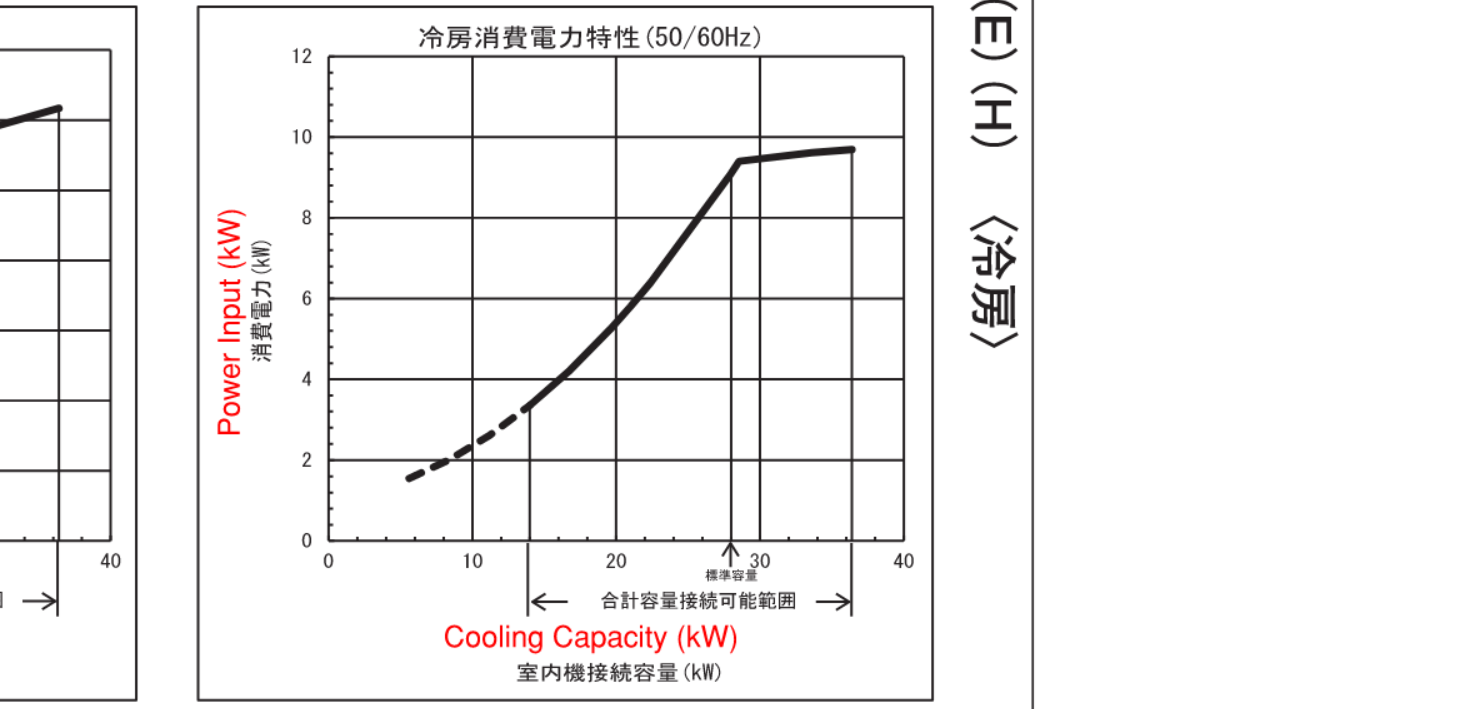
I used Daikin's techinical data. The technical data are sufficient except for Part‐Load Performance Data. There are power input data with PLR between 0.5 to 1.3. Data with PLR between 0.1 to 0.5 are missing. image description

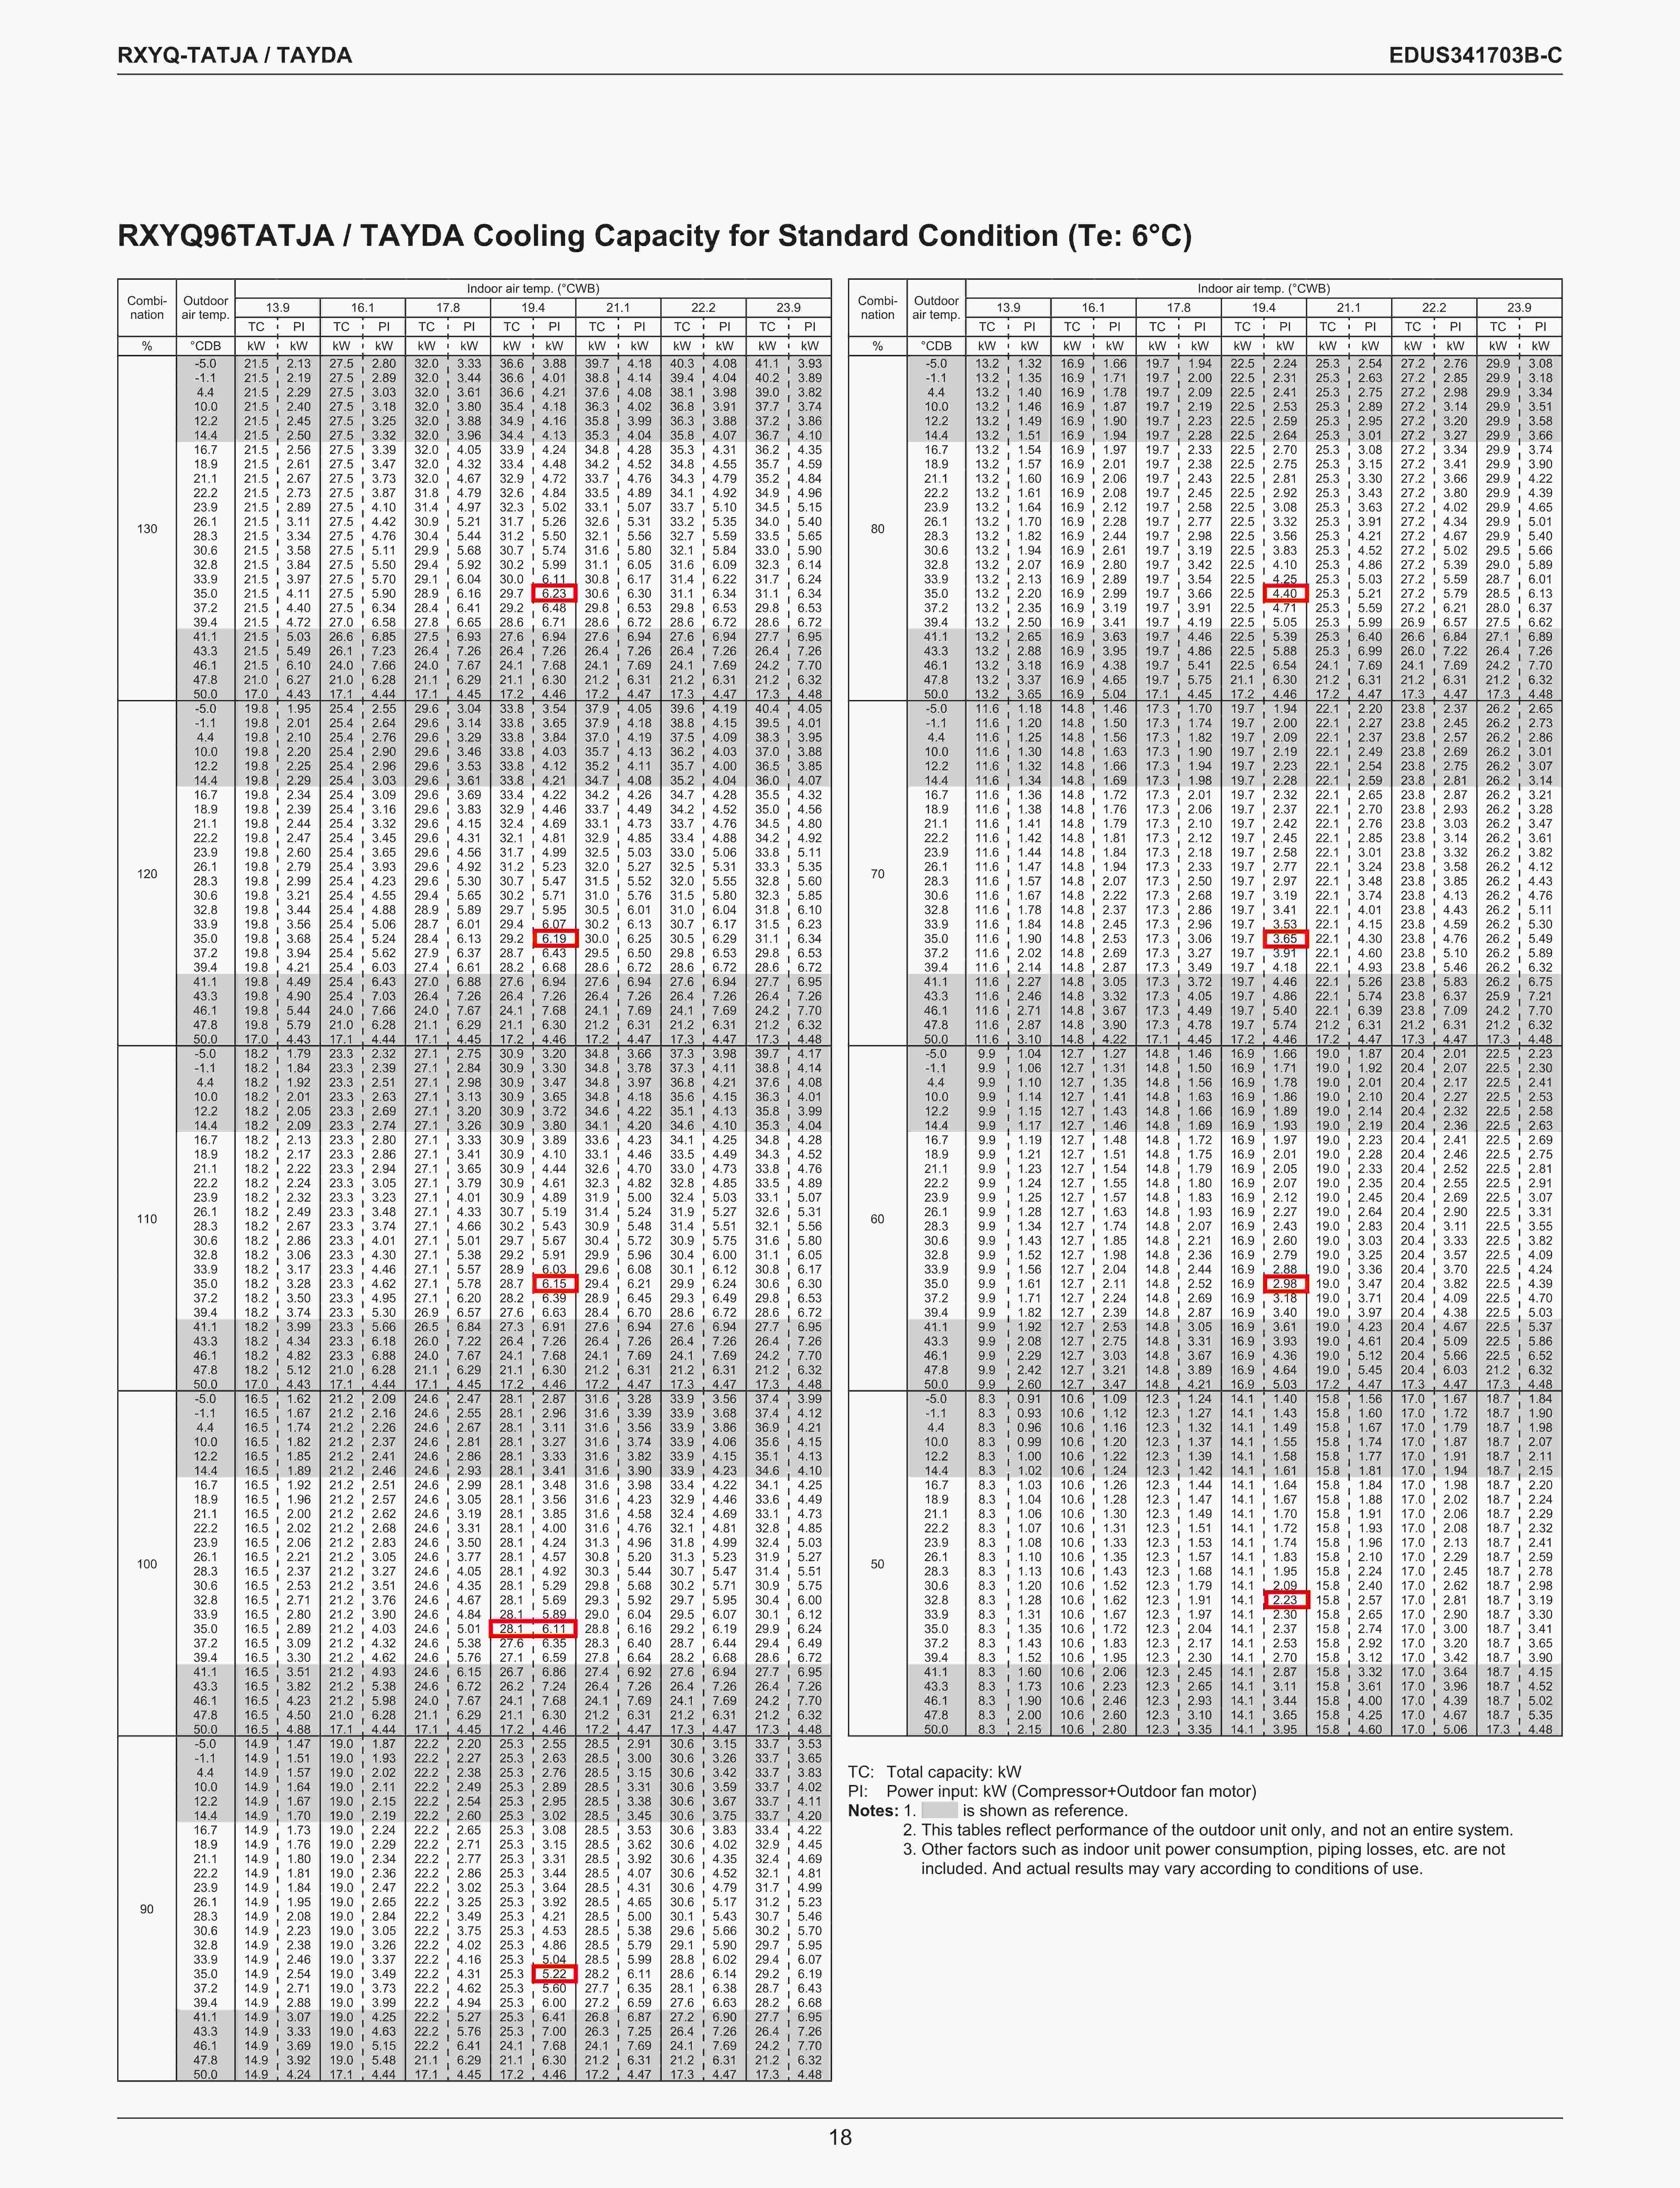
The situation is the same with the paper I mentioned above. So, I think VRF manufacturers do not normally provide power input data with PLR less than 0.5. If that's the case, is it acceptable to predict EIRFPLR curve in the absence of data with PLR less than 0.5? That's my question.

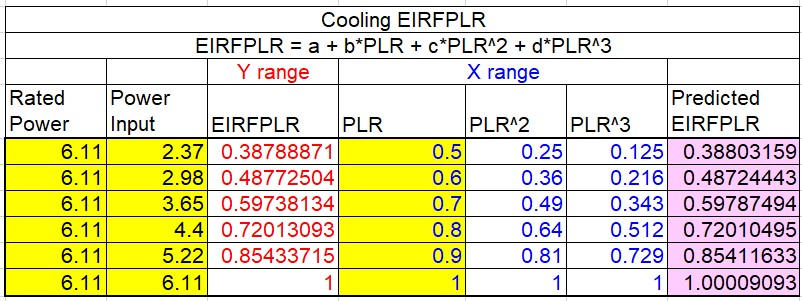
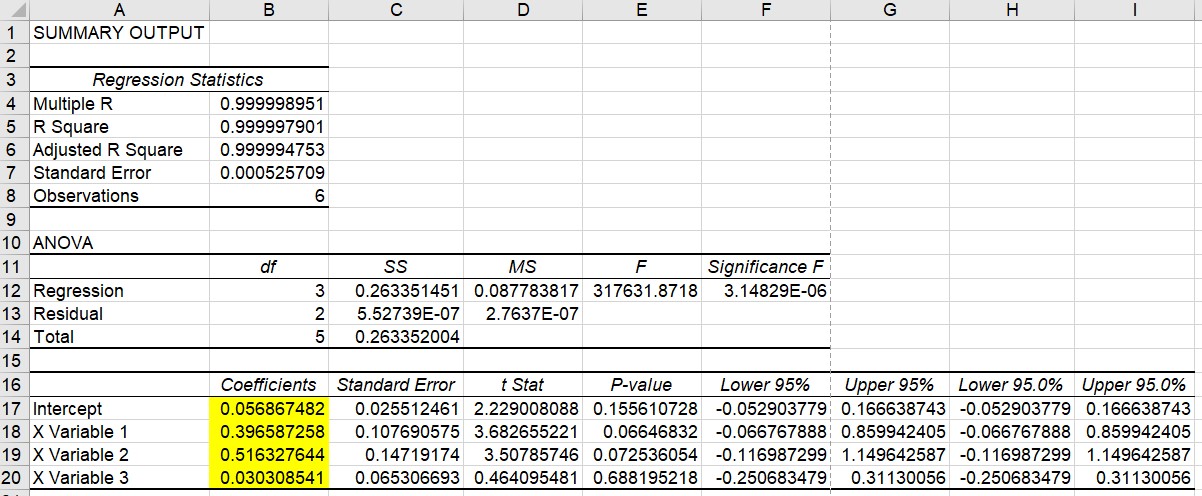
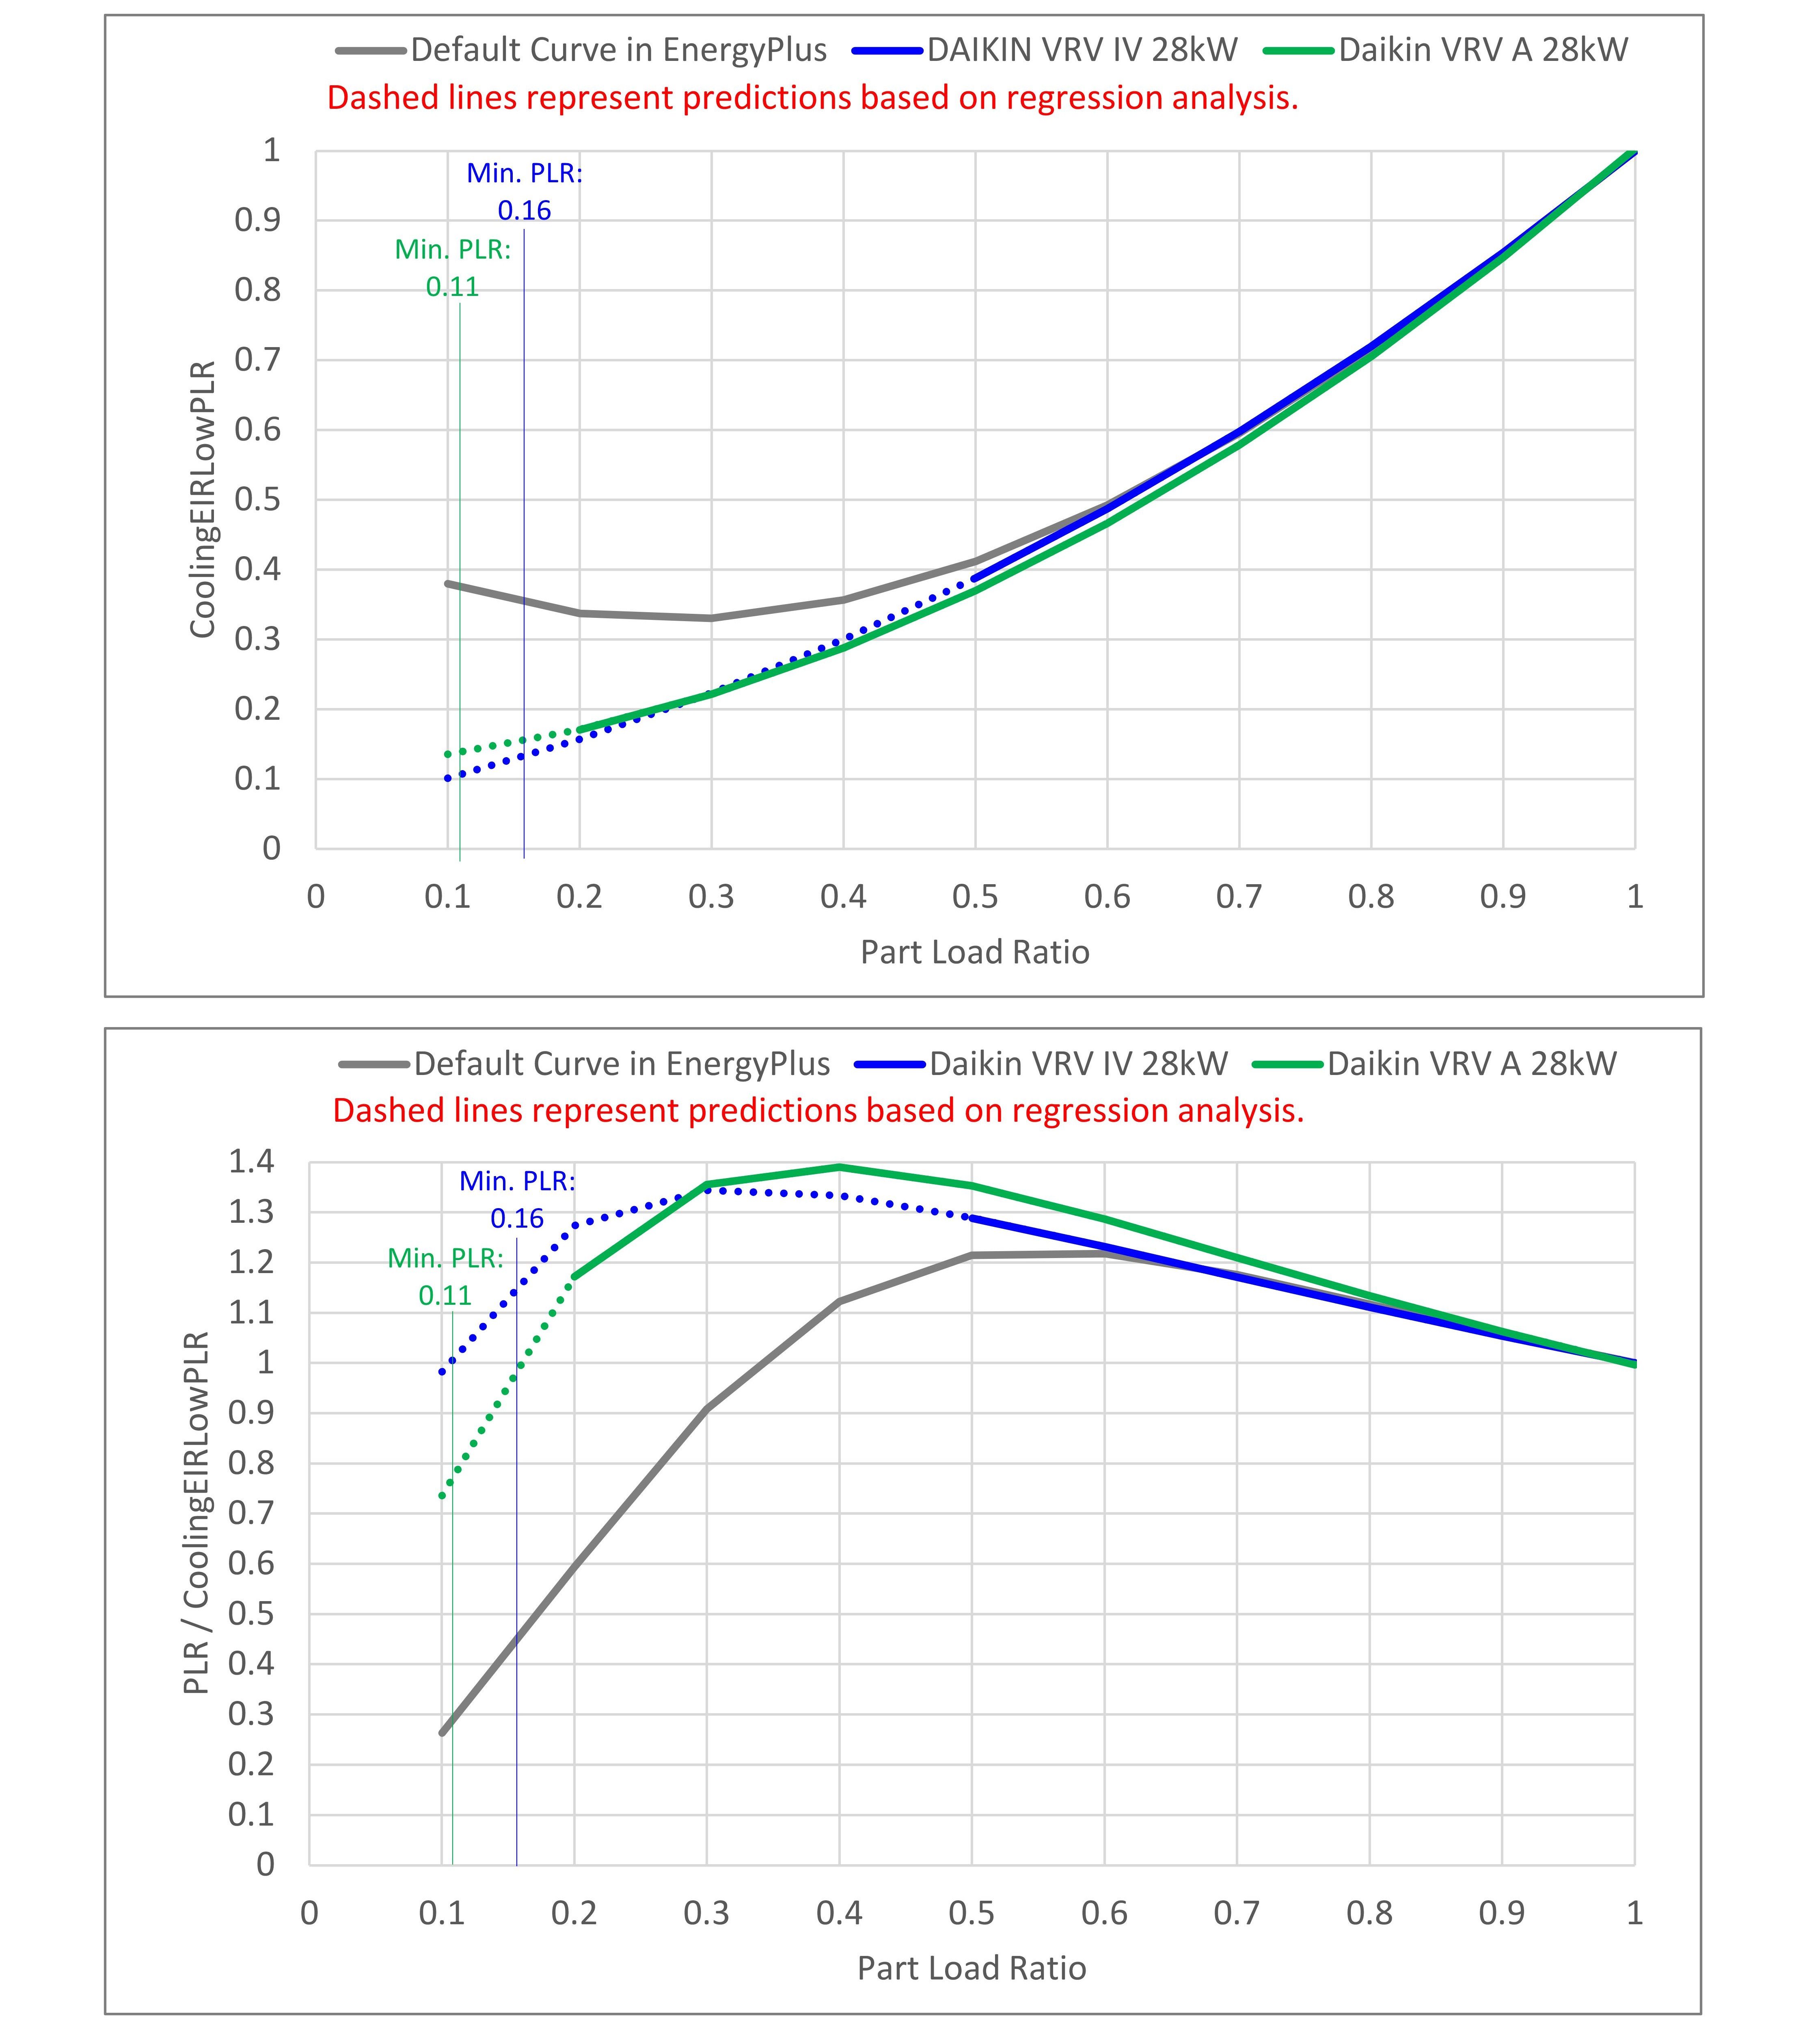
The regression analysis of CoolingEIRLowPLR is as follows. image description

image description

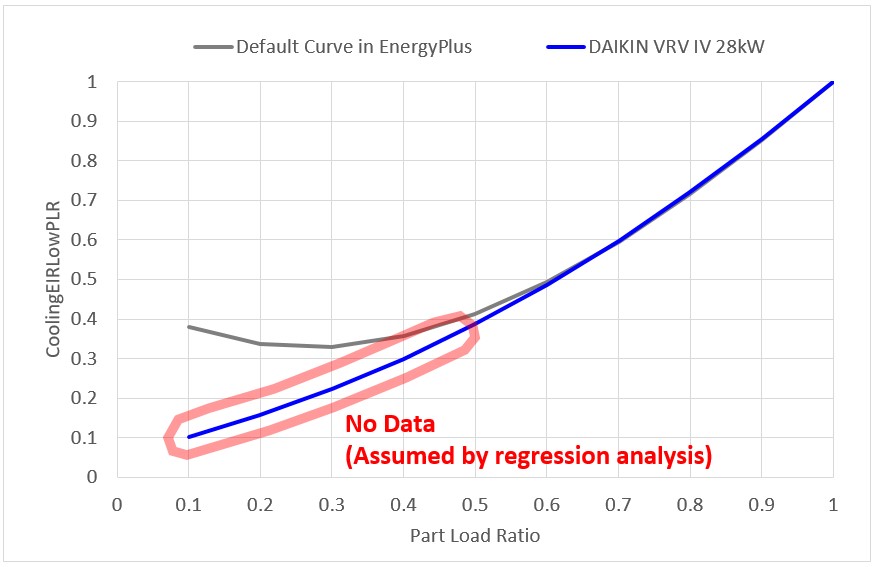
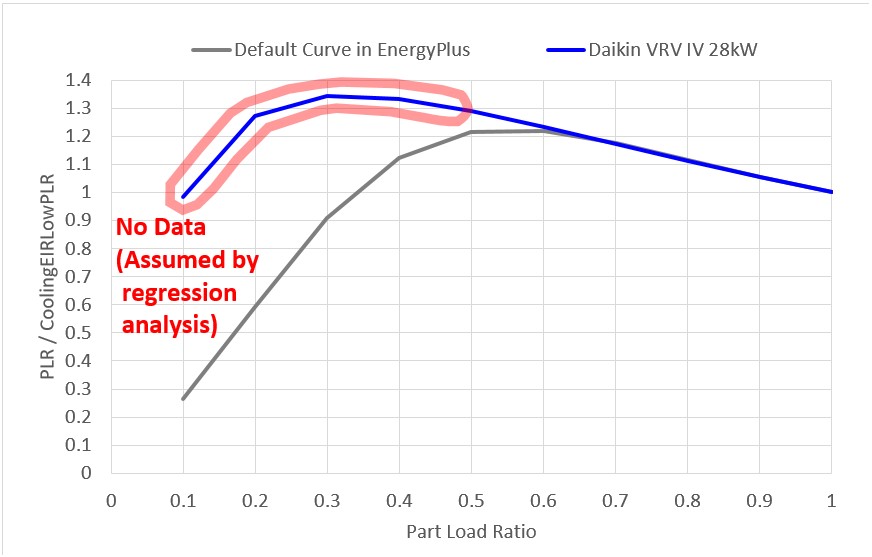
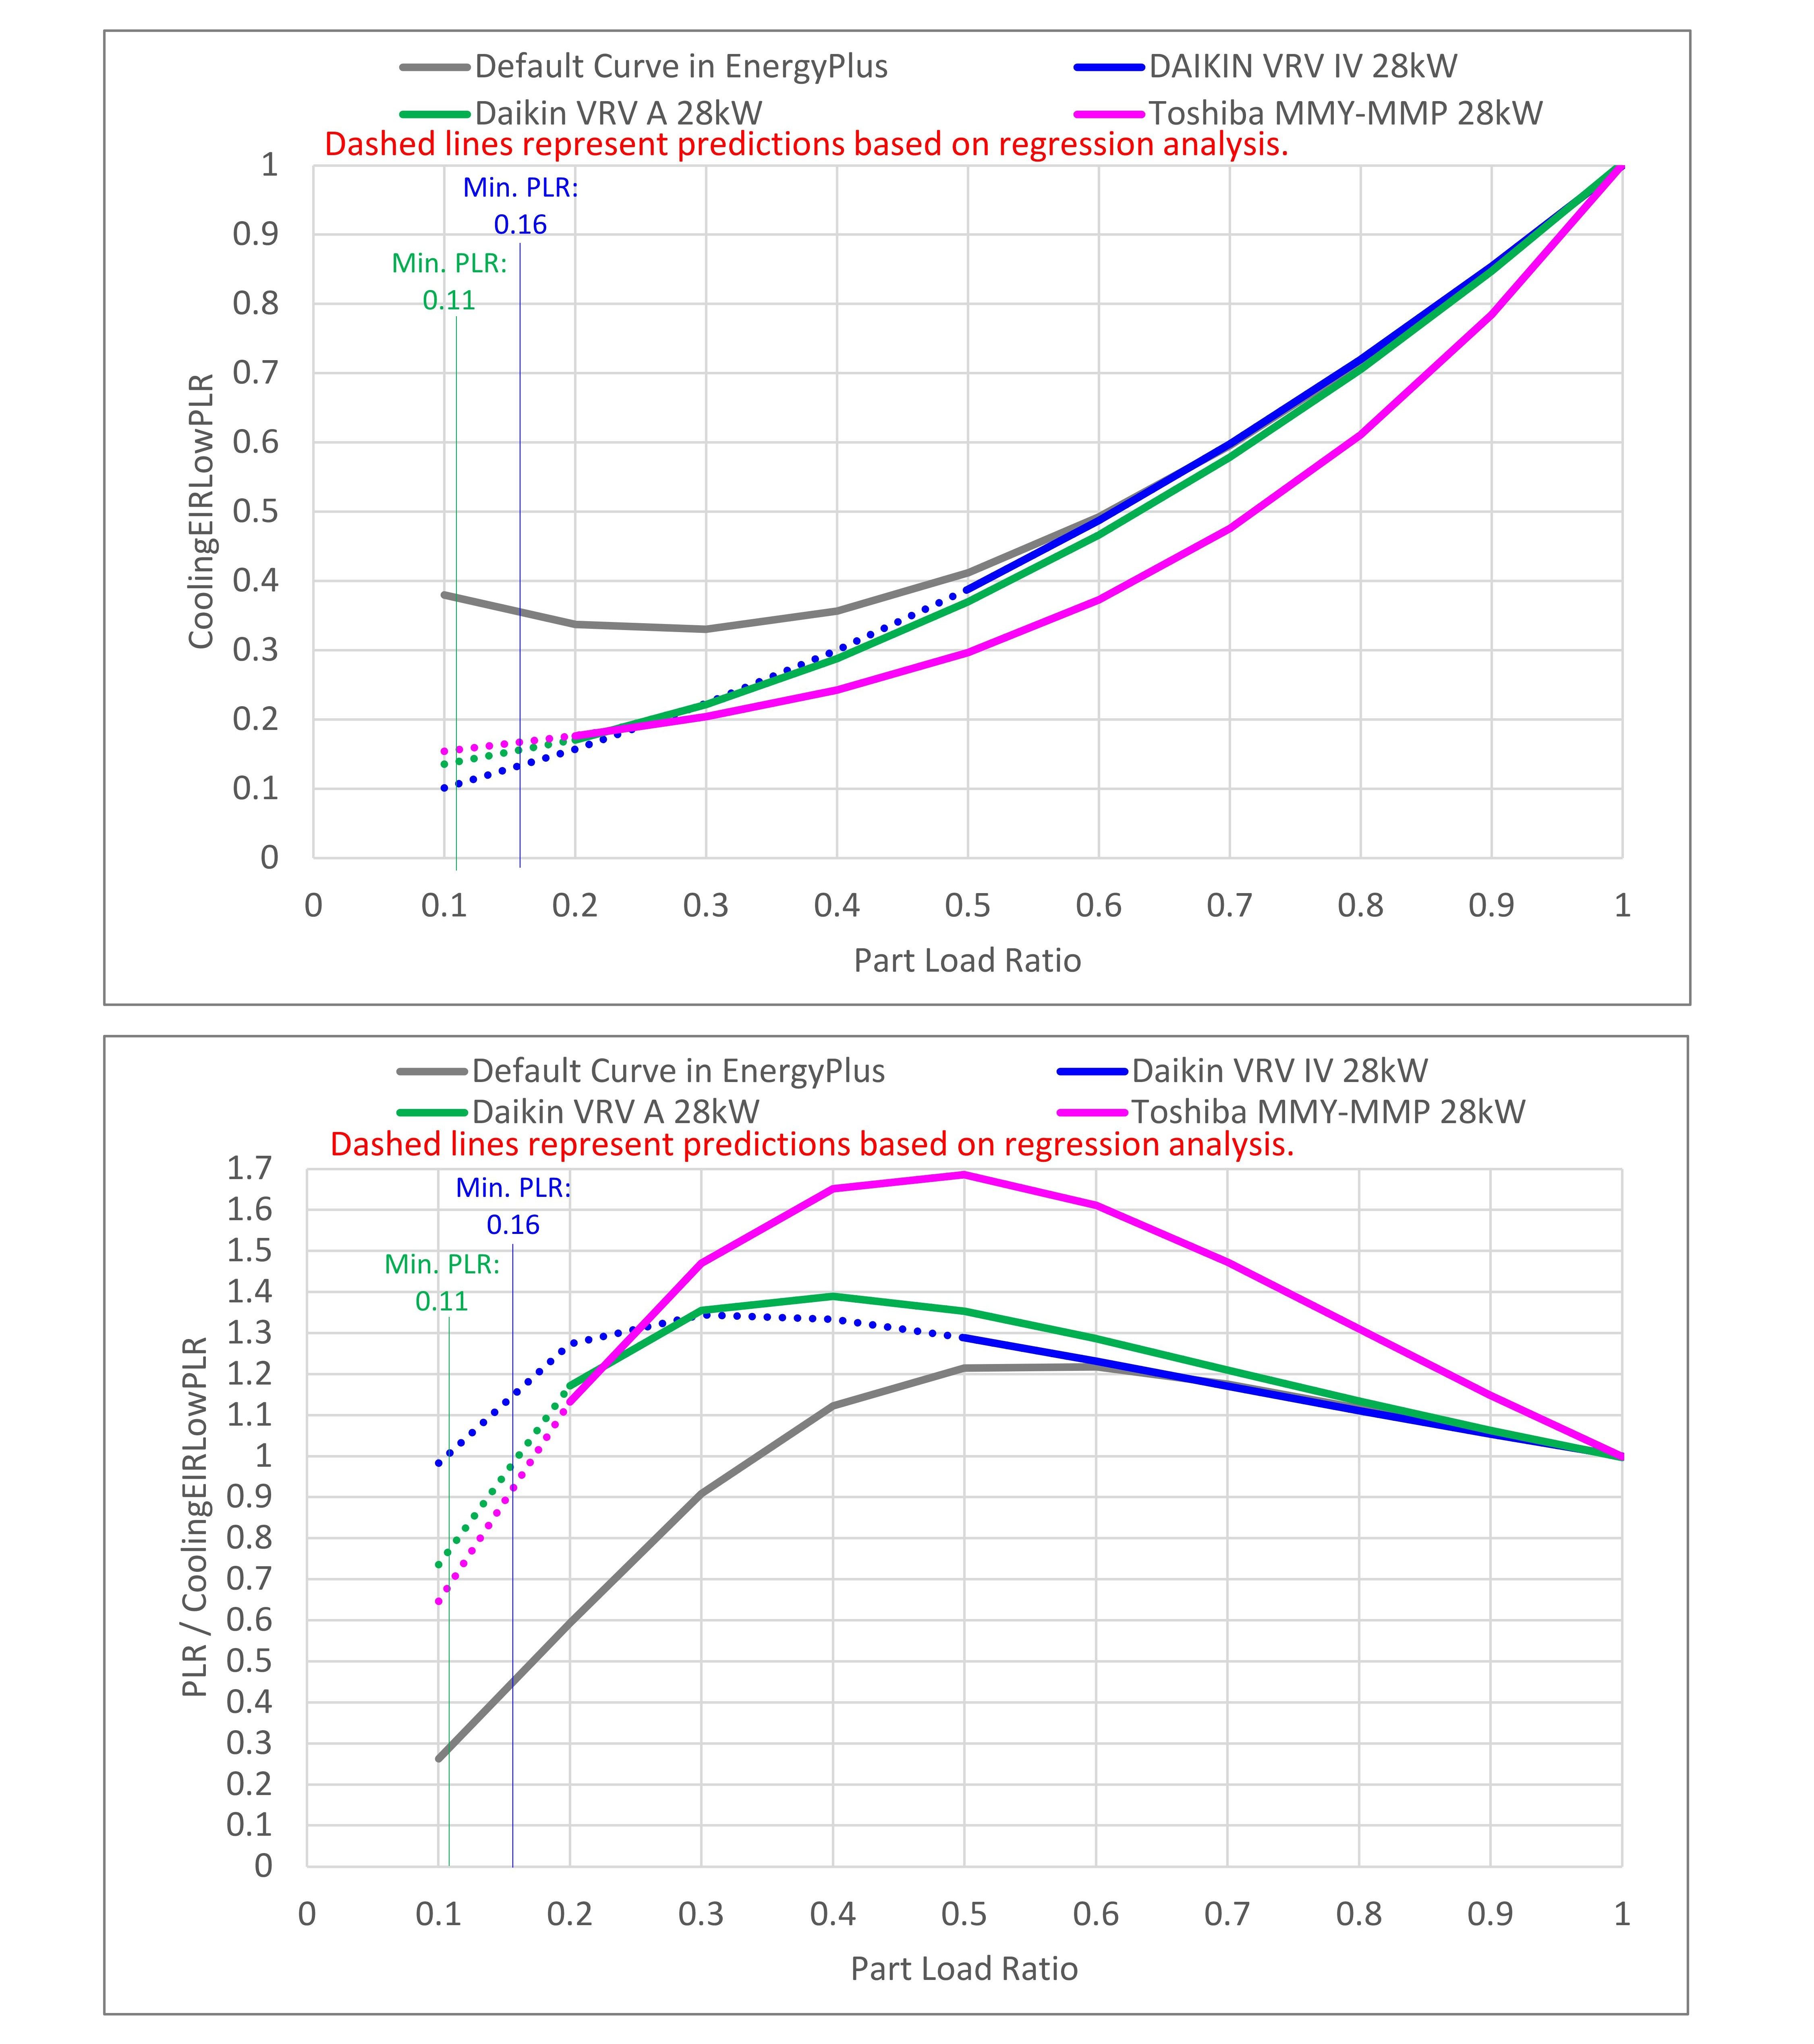
The chart below compares CoolingEIRLowPLR curves with the default one in EnergyPlus and the customised one from Daikin technical data. The curve circled in red is the part supplemented by regression analysis.

image description

For clarity, let's change the chart a bit. I divided PLR by CoolingEIRLowPLR. The chart below can be regarded as the correction factor for cooling COP. This chart is more familiar, at least to me.

image description

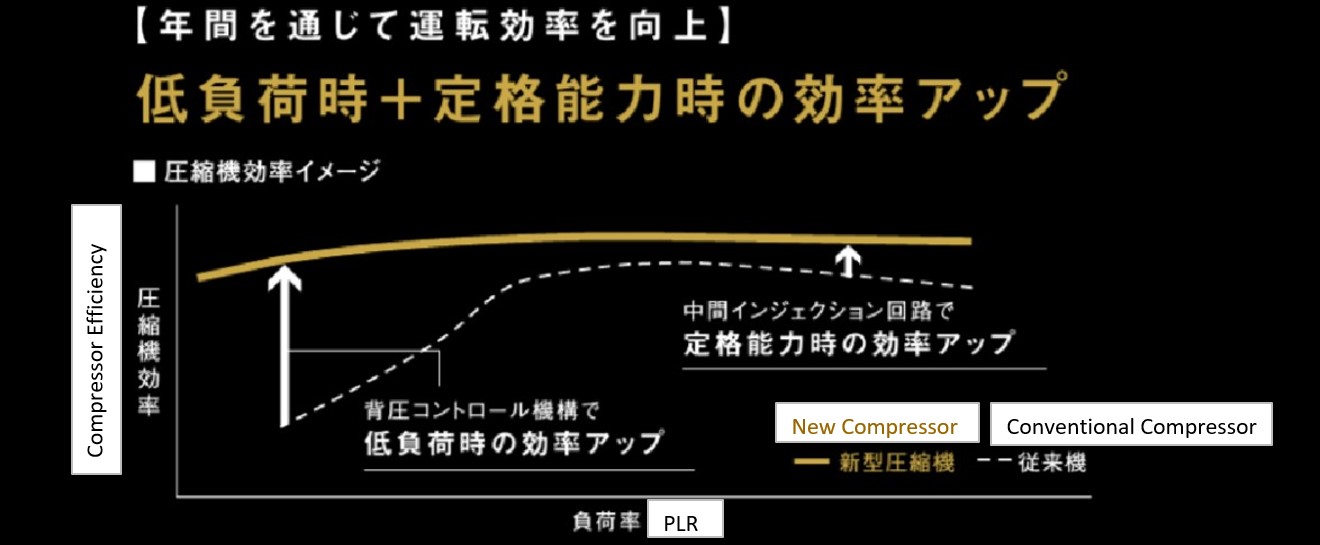
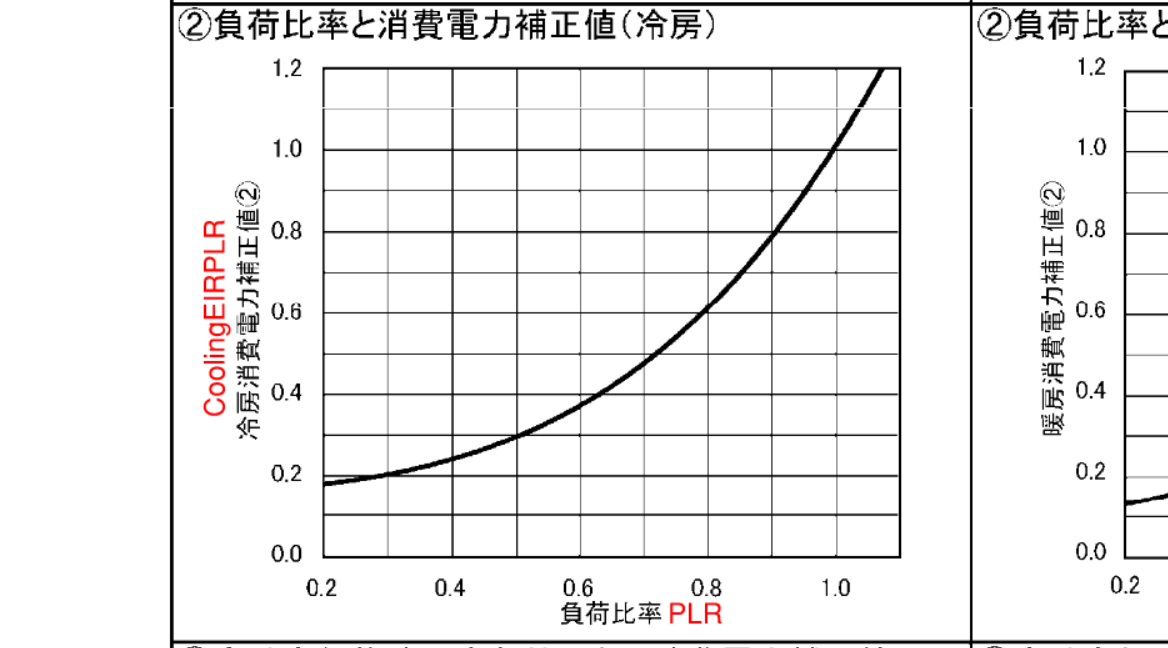
The default curve in EnergyPlus has a poor COP at low part load. I think this default curve is out of date. Below is an extract from Daikin's VRF catalogue issued in 2015. The compressor efficiency at low PLR already improved a lot in 2015. However, the customised curve by regression analysis appears to overestimate the efficiency at low part load a little. That's what bothers me. image description

I don't want to use the default poor EIRFPLR curve, but the customized EIRFPLR curve might be too good. Can I use the customised EIRFPLR curve? Or is there any way to improve the accuracy of regression analysis with insufficient data at low PLR?

The regression data can be found here for your reference.

edit retag flag offensive close merge delete

Comments

@rraustad, your advice would be greatly appreciated.

Keigo's avatar Keigo  ( 2023-01-31 00:11:11 -0500 )edit

@rraustad, thanks for your comment above, but is it in response to this post?

My question here is whether regression analysis is appropriate in the absence of data with a PLR of less than 0.5.

Keigo's avatar Keigo  ( 2023-02-01 22:40:26 -0500 )edit

For VRF, or any vapor compression system really, you need to predict the curves down to MinPLR. Yes, the manufacturers do not typically provide that information so you will either have to work with the manufacturer or use your own judgement. I assumed that the VRF suction temperature would not significantly change at low PLRs, and if that were true then it would take more power to create that condition than if the suction temperature were allowed to float up. I have been present at AHRI certification for VRF systems and those tests do not accurately represent field performance.

rraustad's avatar rraustad  ( 2023-02-02 10:50:04 -0500 )edit

Regarding the last figure, which looks like it came from the manufacturer, I would need to know where those data came from to understand their accuracy with regard to this question. Are these data from AHRI tests? Field data? Computer model? etc. And as @Jim Dirkes mentined, maybe these systems have improved over time, in which case the default curve should be updated.

rraustad's avatar rraustad  ( 2023-02-02 11:03:13 -0500 )edit

I'll try to ask manufacturers to provide data down to MinPLR.

About the last image from Daikin's Catalogue, it is not so quantitative, and I think the test condition is under JIS (Japanese Industrial Standard) which is slightly different from AHRI.

Keigo's avatar Keigo  ( 2023-02-21 22:07:28 -0500 )edit

2 Answers

Sort by » oldest newest most voted
1

answered 2023-01-23 04:47:45 -0500

Jim Dirkes's avatar

Keigo, As usual, you are giving thoughtful consideration to the problem - I appreciate that very much. I think there are two choices:

1) EnergyPlus normally has curves which are based on real equipment and thus are reasonable for use. So... feel confident to use them.

2) As you note, the E+ curves may be out of date for equipment which has seen ongoing improvement. In that case, you can justify and use your "best understanding" for a new curve - much like you are doing already.

Daikin (or other manufacturer) may be able to give you better information than what is published, so it's worth asking for it. On the other hand, the impact of greater accuracy for one curve among many - plus the MANY other variables in your simulation - is probably small. ie, it's probably not worth spending a lot of time trying to get it "perfect".

edit flag offensive delete link more

Comments

Sorry for my late reply. Thanks for your comment. I'll ask manufacturers to provide data down to the minimum part load ratio.

One thing to note is that performance curves especially for curves as a function of PLR affect the simulation result a lot. In my case with the PLR curve above, the annual cooling end use reduced by about 40%, which makes sense as VRF operates under low PLR condition for most of the year. Modelling accurate performance curves is worth spending time in my opinion.

Keigo's avatar Keigo  ( 2023-02-21 22:16:45 -0500 )edit
1

answered 2023-09-24 23:00:59 -0500

Keigo's avatar

updated 2023-09-24 23:07:05 -0500

Daikin's another product has power input data with PLR of 0.2 to 1.3.

image description

I added the curve on the charts below in green. The blue and green curves look very similar compared to the default curve in EnergyPlus. I felt a little more confident about the result of the regression annalysis.

image description


Another example from another manufacturer (Toshiba) is shown below in pink. For the regression analysis at PLR of 0.1, the blue curve might be a little overrated. Minimum Heat Pump Part-Load Ratio of this product is 0.16, but the recent products, especially those with larger capacity, have Minimum Heat Pump Part-Load Ratio of 0.1 or less, so we may need to be cautious when modelling them. One thing I can say for sure is that the default curve in EnergyPlus is outdated and we should always customise it when modelling VRF.

image description

image description

edit flag offensive delete link more

Your Answer

Please start posting anonymously - your entry will be published after you log in or create a new account.

Add Answer

Careers

Question Tools

1 follower

Stats

Asked: 2023-01-22 14:42:29 -0500

Seen: 206 times

Last updated: Sep 24 '23