Question-and-Answer Resource for the Building Energy Modeling Community
| | 1 | initial version |
Daikin's another product has power input data with PLR of 0.2 to 1.3.
I added the curve on the charts below in green. The blue and green curves look very similar compared to the default curve in EnergyPlus.
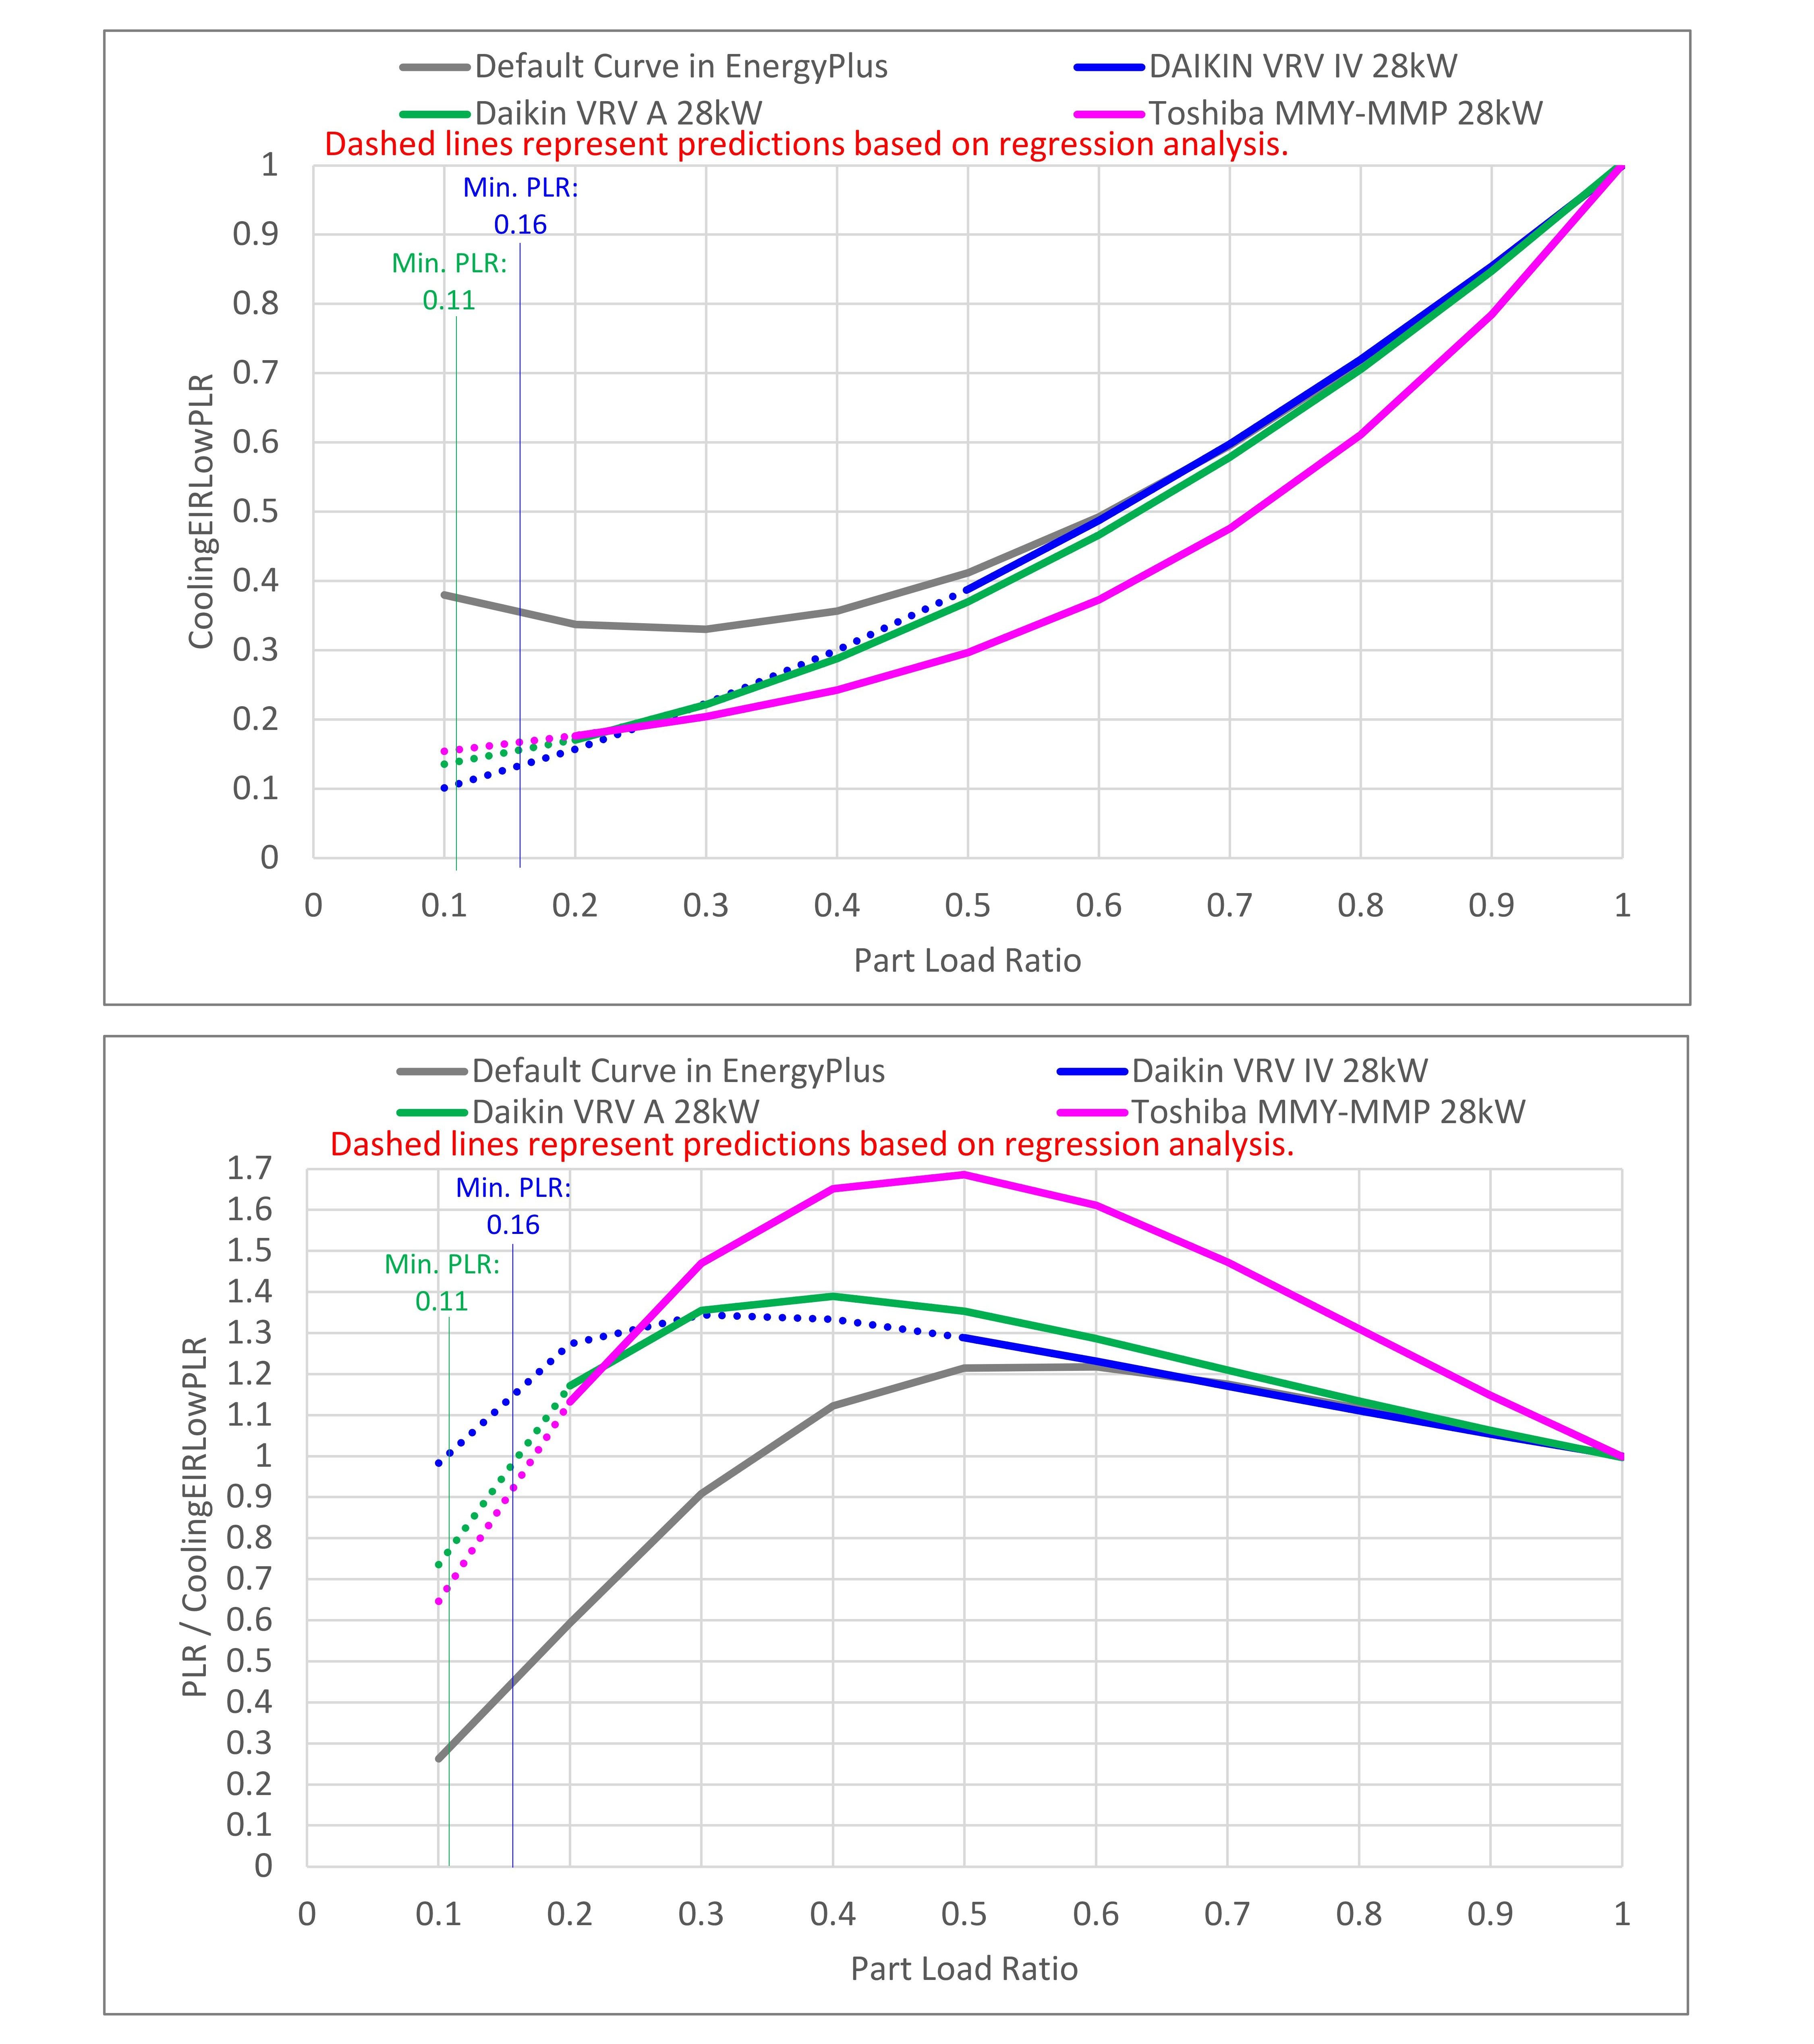
Another example from another manufacturer (Toshiba) is shown below in pink. For the regression analysis at PLR of 0.1, the blue curve might be overrated. Minimum Heat Pump Part-Load Ratio of this product is 0.16, but the recent products, especially those with larger capacity, have Minimum Heat Pump Part-Load Ratio of 0.1 or less, so we may need to be a little cautious when modelling them. One thing I can say for sure is that the default curve in EnergyPlus is outdated and we should always customise it when modelling VRF.
| | 2 | No.2 Revision |
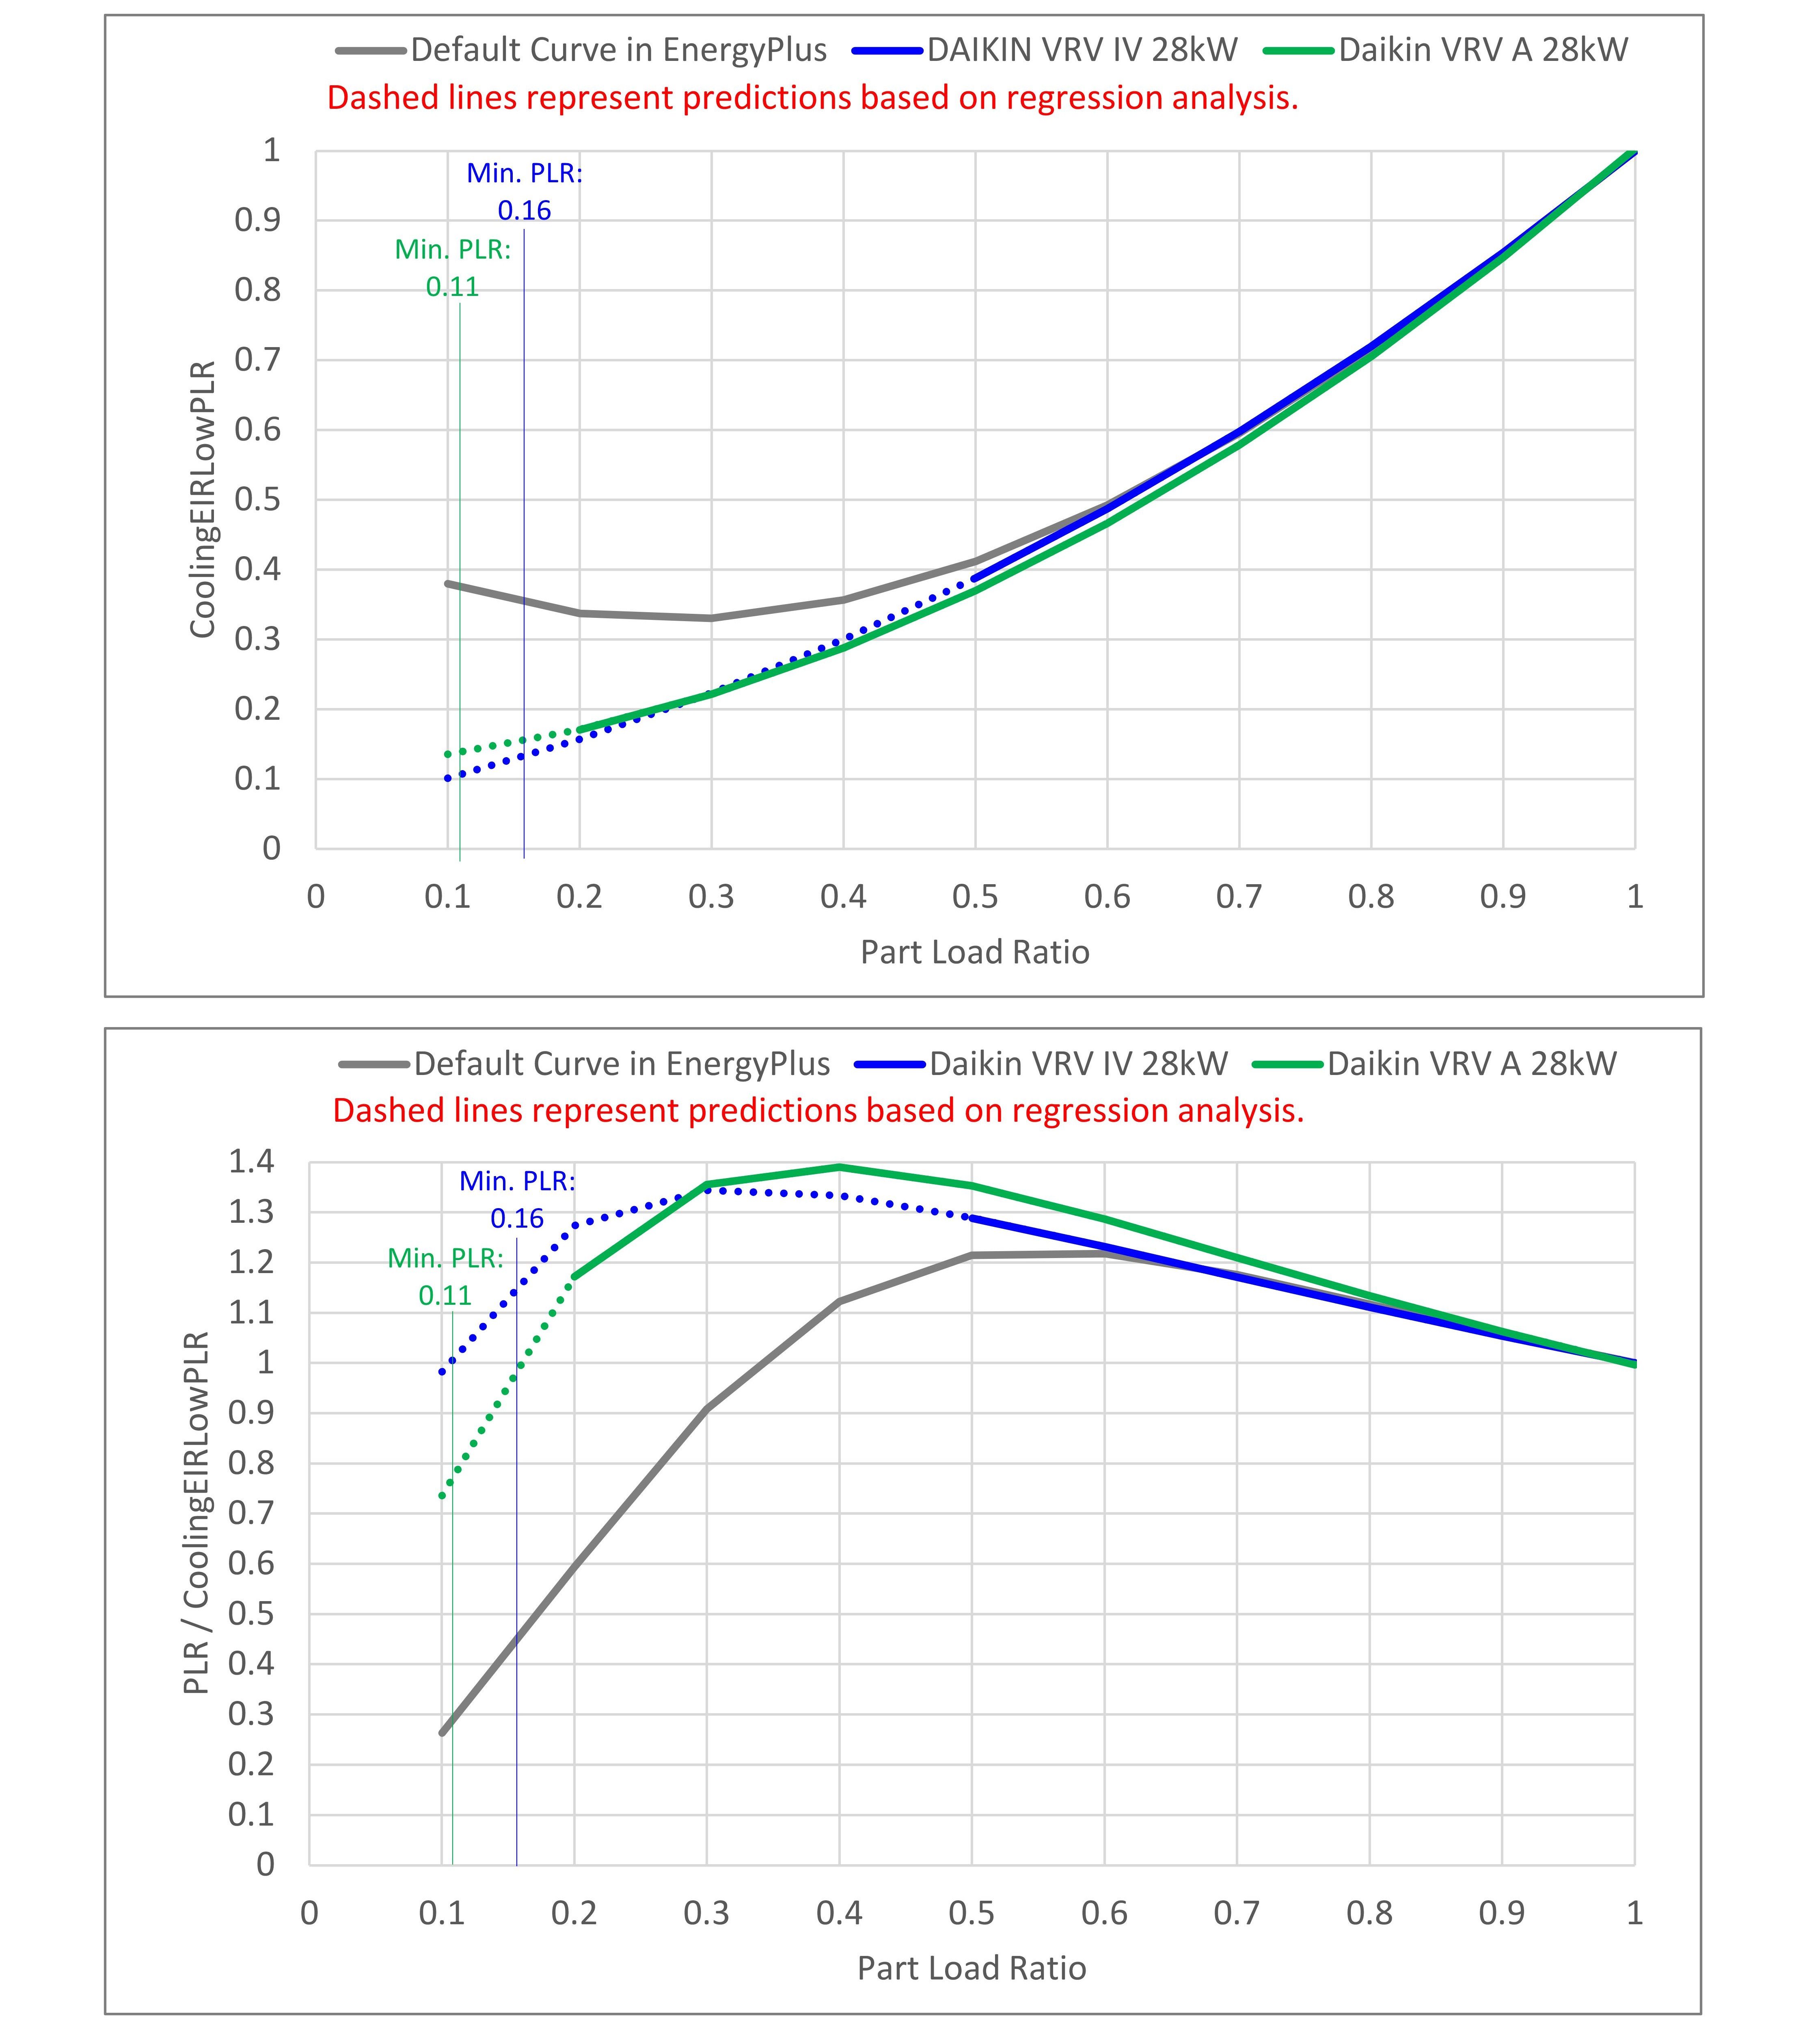
Daikin's another product has power input data with PLR of 0.2 to 1.3.
I added the curve on the charts below in green. The blue and green curves look very similar compared to the default curve in EnergyPlus. I felt a little more confident about the result of the regression annalysis.
Another example from another manufacturer (Toshiba) is shown below in pink. For the regression analysis at PLR of 0.1, the blue curve might be a little overrated. Minimum Heat Pump Part-Load Ratio of this product is 0.16, but the recent products, especially those with larger capacity, have Minimum Heat Pump Part-Load Ratio of 0.1 or less, so we may need to be a little cautious when modelling them. One thing I can say for sure is that the default curve in EnergyPlus is outdated and we should always customise it when modelling VRF.

