Question-and-Answer Resource for the Building Energy Modeling Community
Get started with the Help page
Ask Your Question
1

Data Viewer (DView) Incorrectly Labeling Y Axis?

asked 2 years ago

updated 2 years ago

I've searched a bit on the forum (keyword "Data Viewer") and not found anything.

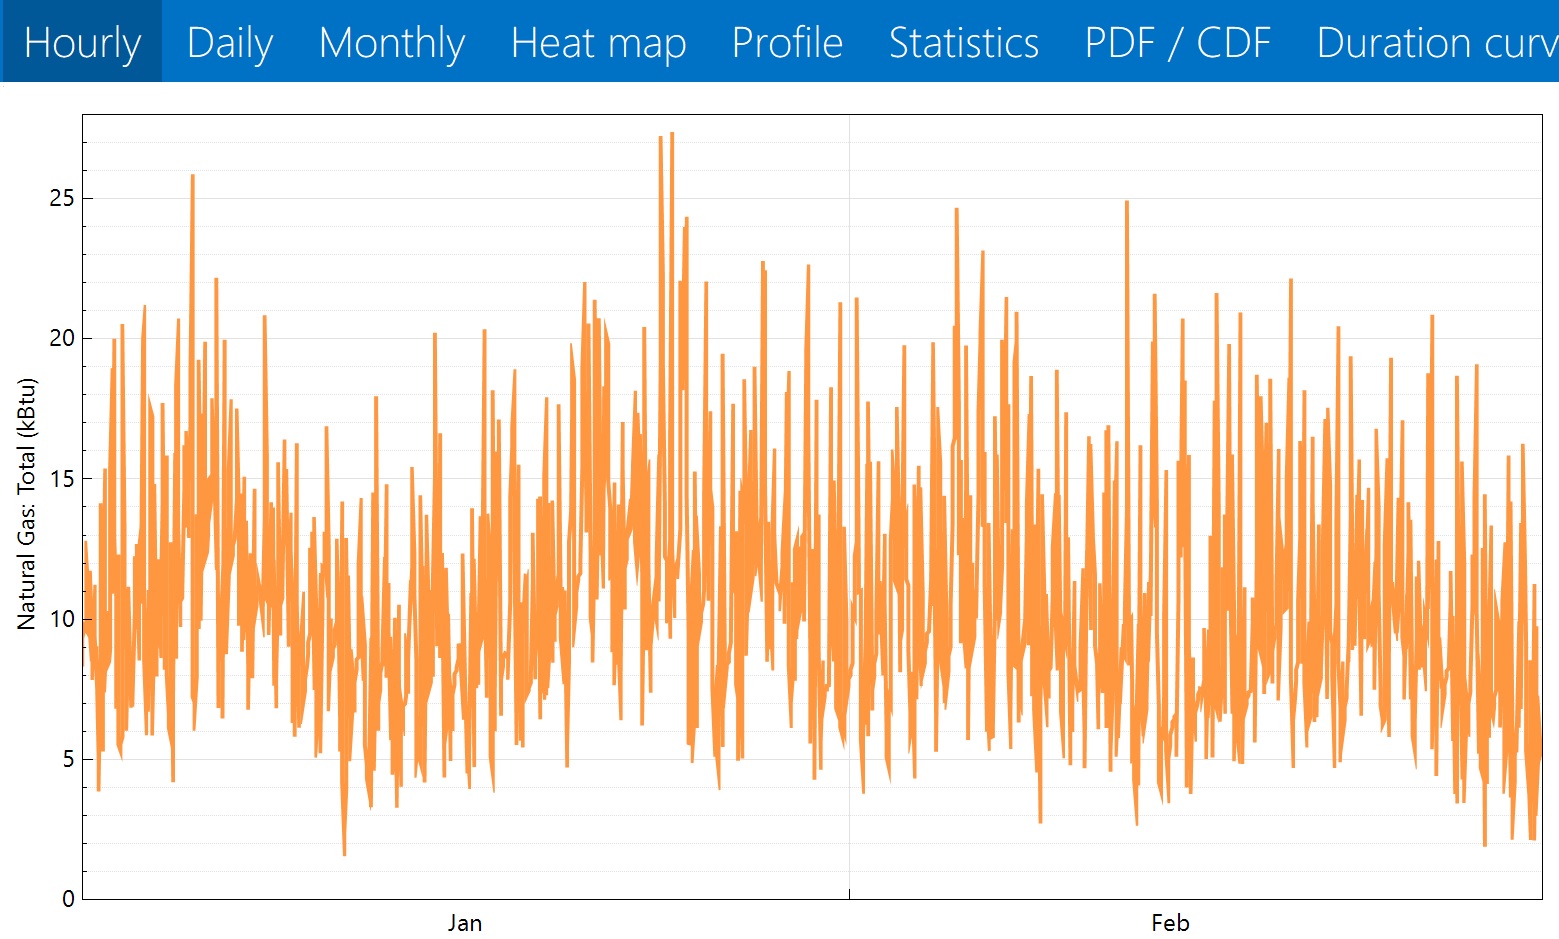
I've been using the Data Viewer "hourly," "daily," and "monthly" graphs to help me size my heating and hot water systems. I think the "hourly" data is accurate, as it gives me a result in about the ballpark I'd expect for a home of that size. It's measured in total kBTU, and since the graph is in intervals of 1 hour that means it's actually total kBTU per hour.

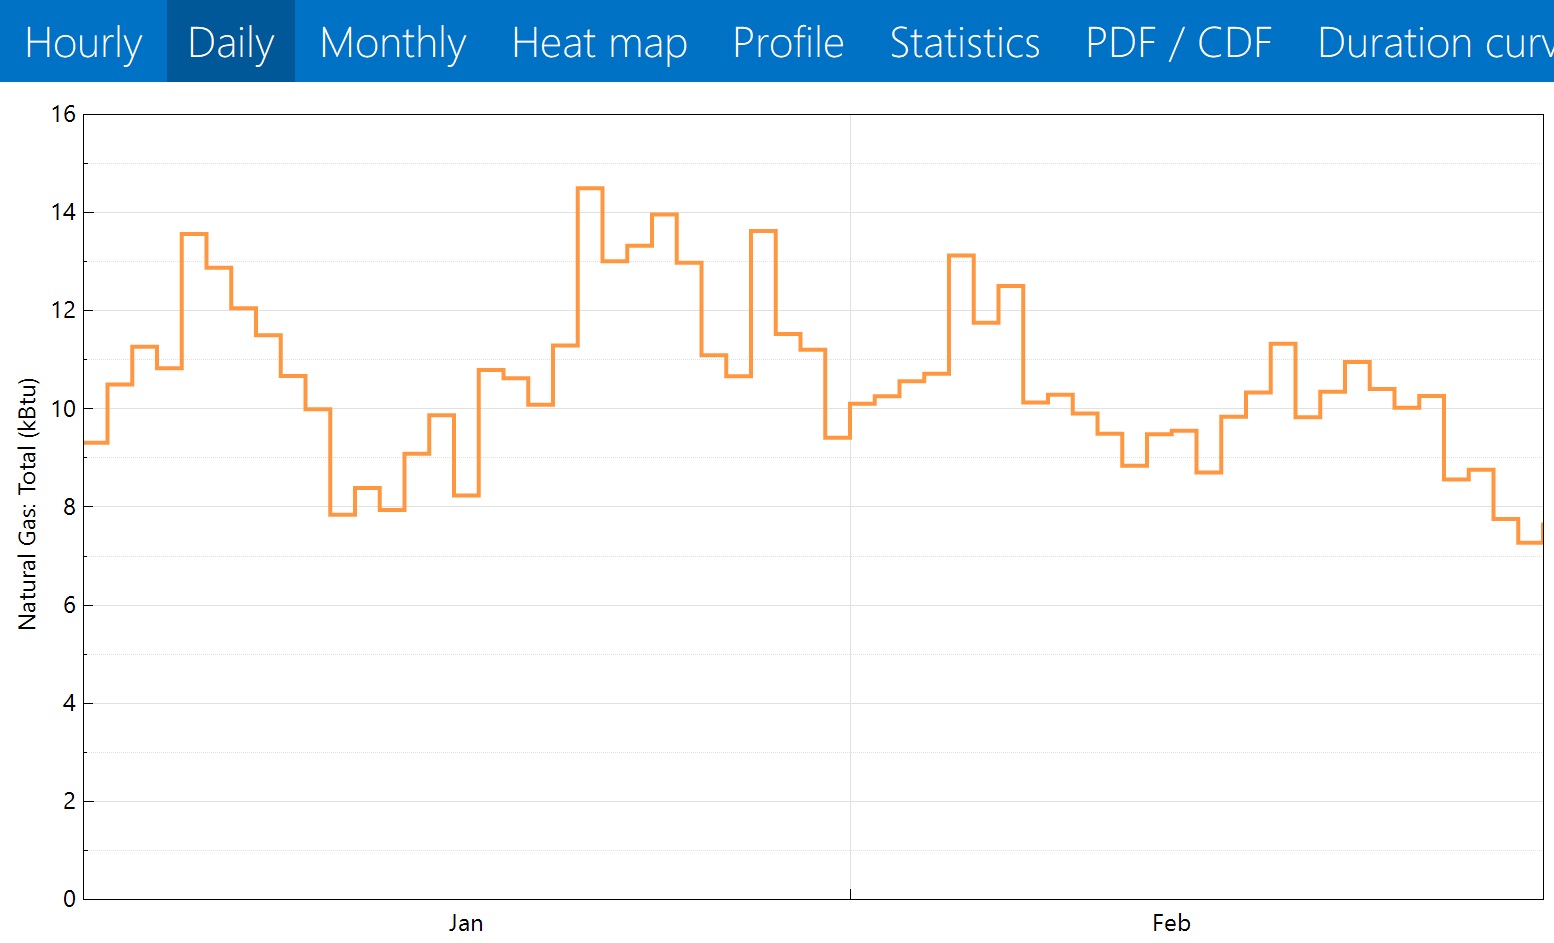
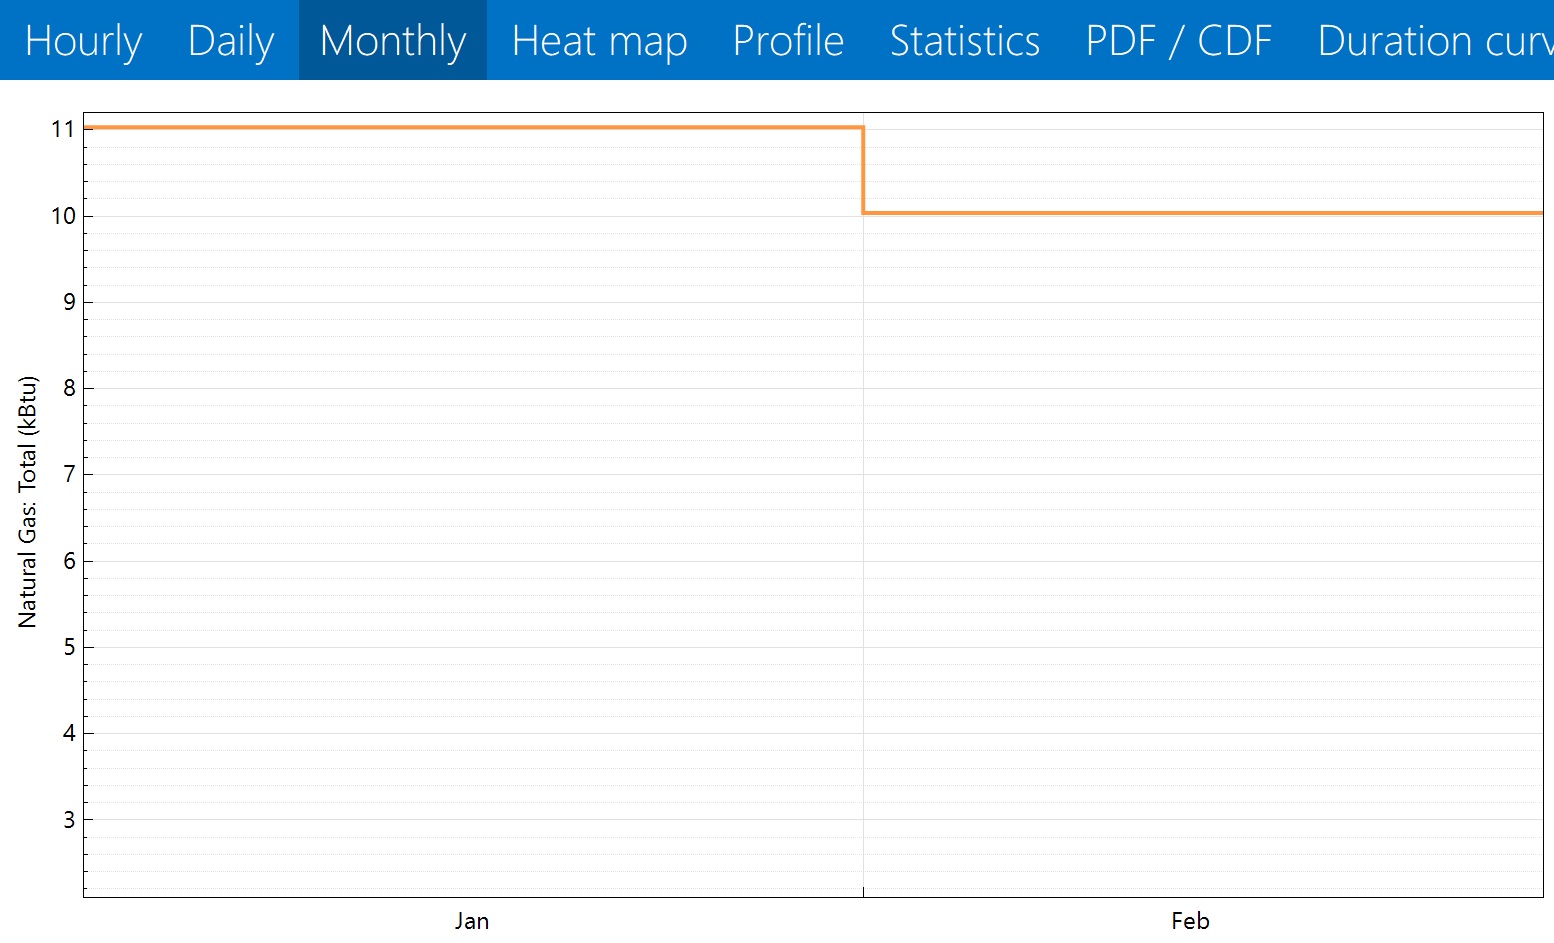
The issue is with the daily and monthly graphs: It also claims that the units are total kBTU, in this case per day or per month. However those numbers appear to actually be average hourly kBTU per day or per month--because how else would the coldest day of the year give me about 27 kBTU/hr of peak use but only 14.5 kBTU of use in total?

I guess I just want to see if I'm missing something, or if this is, indeed a known misstatement. And if so, if I'm right in thinking that those graphs should be reading Average kBTU/hr.

Edit: Here are the graphs.

image description

image description

image description

Preview: (hide)

Comments

@desert_sasquatch you should have enough karma points now to upload an image to your post. You can also save images on a service like Imgur, Dropbox, etc. and share the URL to those in your post.

Aaron Boranian's avatar Aaron Boranian  ( 2 years ago )

Thanks Aaron. The images should be up now.

desert_sasquatch's avatar desert_sasquatch  ( 2 years ago )

1 Answer

Sort by » oldest newest most voted
2

answered 2 years ago

DView always defaults to showing averages, whether averaging sub-hourly values for the Hourly tab or averaging hourly values for the Daily/Monthly tabs. (For some variables, like temperatures, it would be fairly meaningless to show sums rather than averages.) As DView is general purpose software tool and simply displays the data it is provided, it doesn't really know what the data means/represents, so it would be difficult to automatically change the provided units (e.g., kBtu) for different displays.

If you click on the Wrench button in the lower-right hand corner of a given timeseries display, you can choose to have DView show sums instead of averages. You may need to re-select a variable to have it display correctly.

Preview: (hide)
link

Your Answer

Please start posting anonymously - your entry will be published after you log in or create a new account.

Add Answer

Training Workshops

Careers

Question Tools

Stats

Asked: 2 years ago

Seen: 97 times

Last updated: Jan 31 '23