Question-and-Answer Resource for the Building Energy Modeling Community
Get started with the Help page
Ask Your Question
2

Is the 'AirLoop Component Load Summary' indicating the Block Load or Peak Load in EnergyPlus report?

asked 2021-10-01 16:56:19 -0500

updated 2021-10-04 07:56:33 -0500

The attached image suggests the 'AirLoop Component Load Summary' is indicating the Peak Load data. But when the zone level loads (fenestration solar, people, lights, etc.) are summed up, the difference suggests it might be the block load that is being indicated in the EnergyPlus report. Is this the case or is there any other section of the report which indicates the block loads of the air systems? Thank you in advance for your help.image description

edit retag flag offensive close merge delete

Comments

1

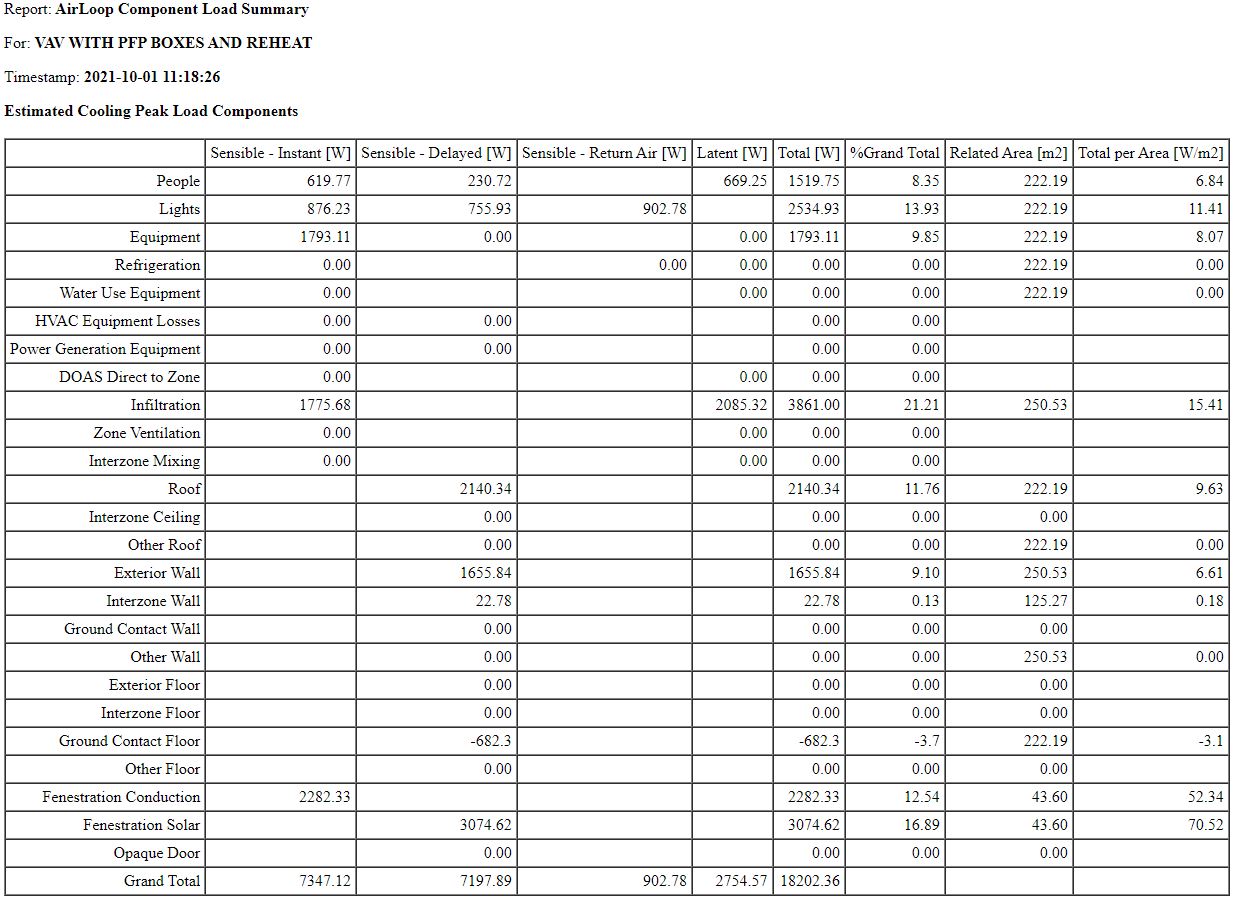
@MagicAxe could you try to attach your image again? It doesn't look like it worked the first time.

Aaron Boranian's avatar Aaron Boranian  ( 2021-10-02 09:58:49 -0500 )edit

Thanks, Aaron. I reattached the image.

MagicAxe's avatar MagicAxe  ( 2021-10-04 07:56:03 -0500 )edit

1 Answer

Sort by ยป oldest newest most voted
3

answered 2021-10-05 10:30:31 -0500

The Zone Component Loads Summary is computed at times for the individual zones while the Airloop Component Loads Summary is computed at the time that the peak occurs for the airloop across all zones that are served by that airloop. In that way, the report is similar to a block load is calculated. Please take a look at the documentation for the report.

InputOutputReference Component Load Summary

Engineering Reference Component Loads Summary

Output Details and Examples Component Loads Summary

edit flag offensive delete link more

Your Answer

Please start posting anonymously - your entry will be published after you log in or create a new account.

Add Answer

Careers

Question Tools

2 followers

Stats

Asked: 2021-10-01 16:56:19 -0500

Seen: 426 times

Last updated: Oct 05 '21