Question-and-Answer Resource for the Building Energy Modeling Community
Get started with the Help page
Ask Your Question
3

How to make custom E+ SQL output for DView

asked 2021-08-03 14:03:09 -0500

mechyai's avatar

updated 2021-08-18 13:48:15 -0500

Hello,

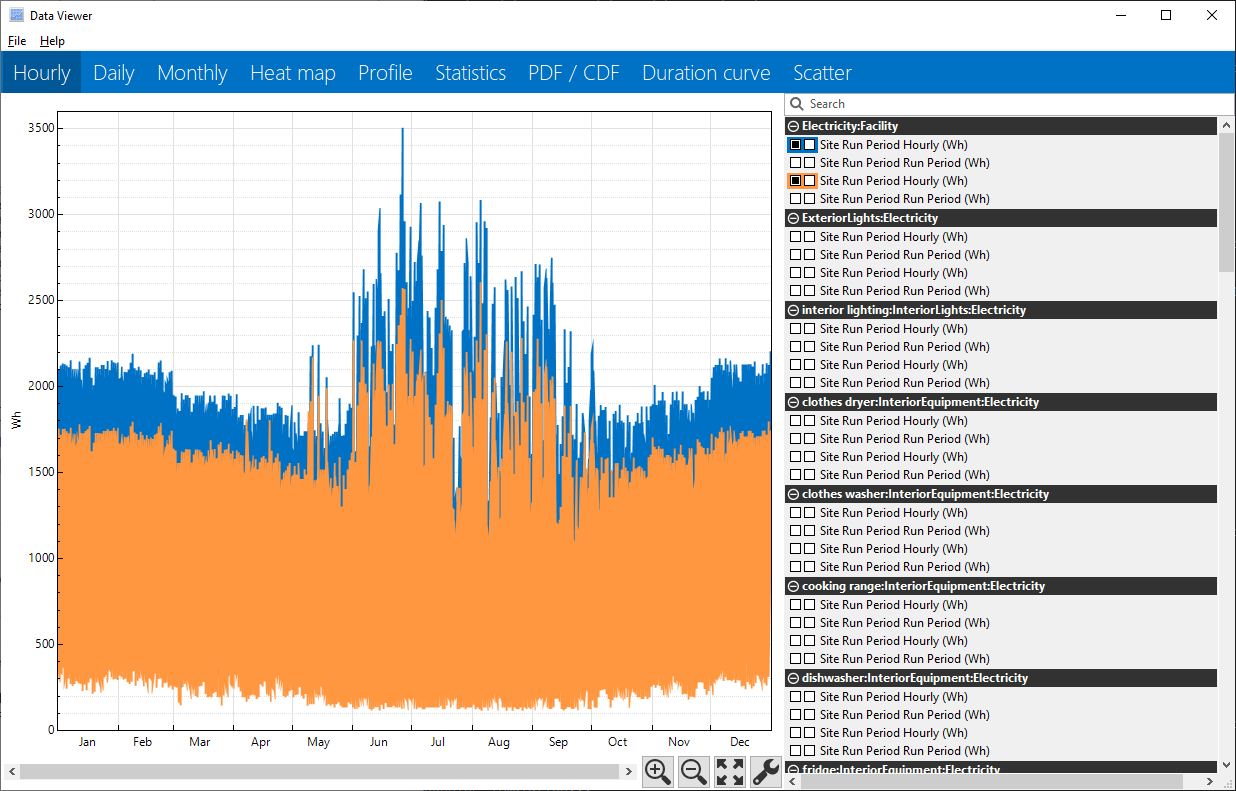
I am trying to combine outputs from various simulations and add other custom time-series data (created outside E+) into a single 'eplusout.sql' so that I can compare multiple simulations in DView. Is this feasible?

I am using EMS Python, so it is not hard for me to capture and save the proper data from multiple simulations, I just have no clue how to combine it into a proper SQL file that DView can open.

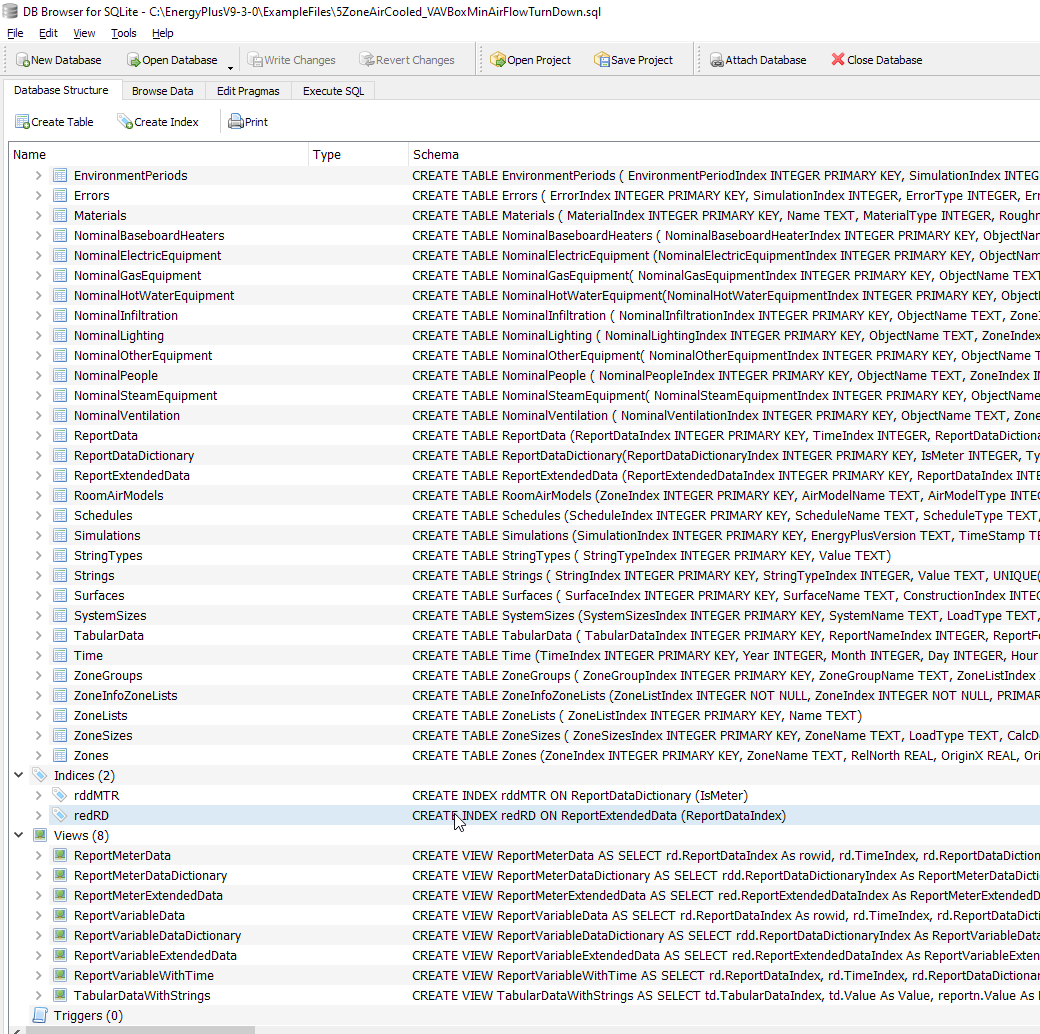
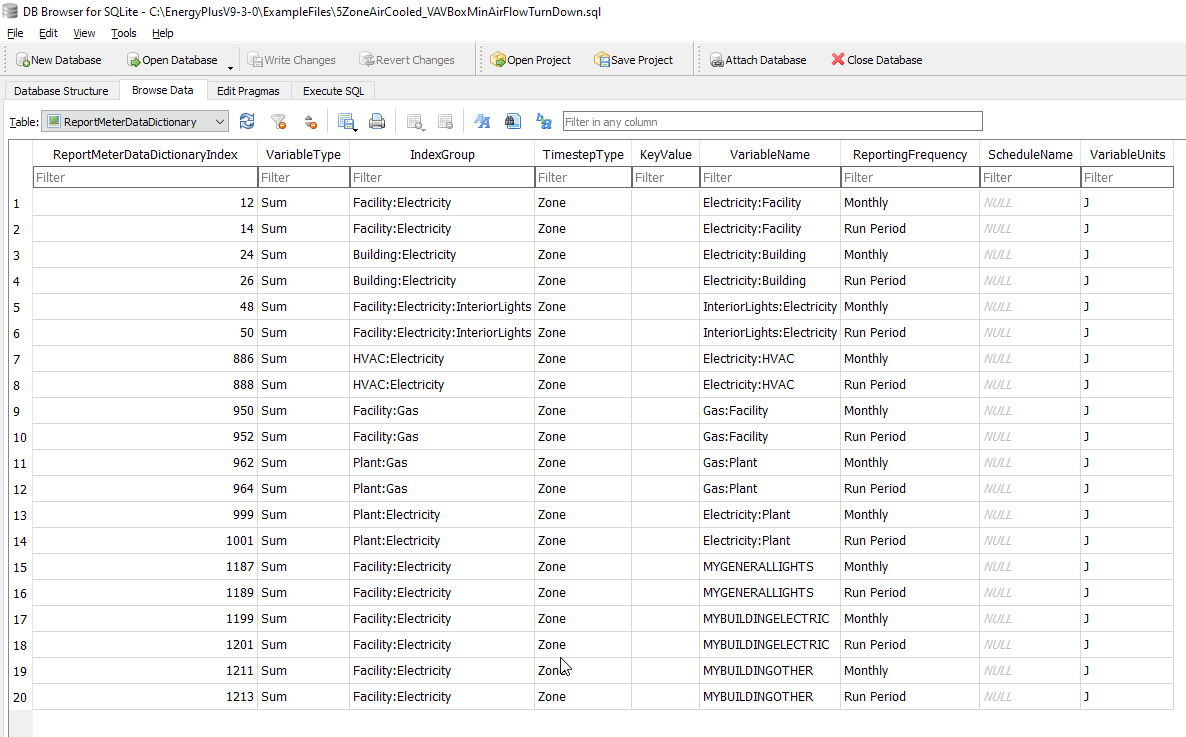
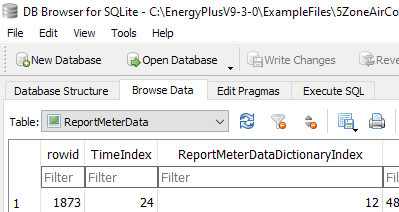
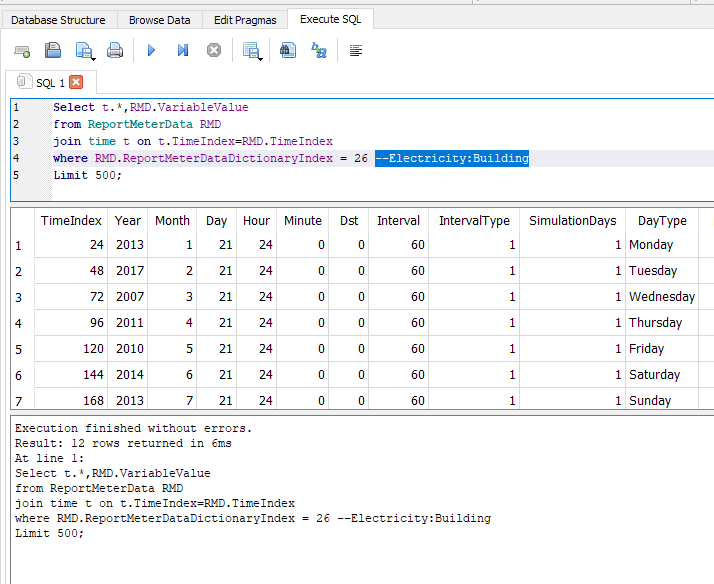
I have been looking into the eplusout.sql file, DView, and SQL basics and cannot find the information I am looking for. The most that I know is that the eplusout.sql file/database is SQLite3 format. But I have not been able to dig deeper into the file as I am having trouble opening it in ways other than with DView. I have tried to open it in MySQL Workbench but cannot find/select the proper encoding for the Eplusout.sql SQLite3 file (I don't know how the eplusout.sql is encoded). Also, the methods in Python given from this post throw bugs I cannot figure out.

I don't have any experience with SQL so I am presently trying to learn it, but the other components of modifying eplusout.sql and using DView with custom SQL files I am lost.

edit retag flag offensive close merge delete

3 Answers

Sort by ยป oldest newest most voted
2

answered 2021-08-03 20:59:24 -0500

jhtravis's avatar

I can help you get into the Sqlite files. On free tool in windows is "sqlitebrowser" which can be installed here: https://sqlitebrowser.org/dl/. There are other database IDE's (Dbeaver being another good one) but if you just need sqlite3 browsing this should work.

Now an incomplete summary of the Sqlite structure is shown in the next 3 images:

Table Structure of the SQLITE Outputs:

image description

Data Elements of the Meters that are outputs as reports:

image description

The location of the observations for each meter:

image description

Now for an example, if you wanted to return all of the results of "Electricity:Building" for each run period you could use the following query in the "Execute Query" tab. To return all results remove the final line "Limit 500" or comment it our with two dashes before the line "--".

Select t.*,RMD.VariableValue
from ReportMeterData RMD
join time t on t.TimeIndex=RMD.TimeIndex
where RMD.ReportMeterDataDictionaryIndex = 26  --Electricity:Building
Limit 500;

Image of the following query is here:

image description

Per your question of joining the two sql lite files I don't think this is feasible but I haven't looked into Dview. By using these queries you could also setup Python to extract the values you want and visualize both of them in a Python visualization. This link could help if you explored that path further: https://docs.python.org/3/library/sql....

edit flag offensive delete link more

Comments

Thank you, this is very helpful and what I was looking for!!

mechyai's avatar mechyai  ( 2021-08-04 21:23:23 -0500 )edit

@jhtravis I have not been able to open the eplusout.sql file in either DBeaver or DB Browser for SQLite. I get this error "Error importing data: Error in statement #1: near "SQLite": syntax error. Aborting execution." when I try to import the eplusout.sql file from my simulation.

Do I need to have some sort of SQLite installed on my system to use these apps?

mechyai's avatar mechyai  ( 2021-08-05 14:11:50 -0500 )edit
1

answered 2021-08-04 08:59:00 -0500

Dview already allows comparing results from multiple simulations:

  1. Launch DView, click File -> Open, and select the first EnergyPlus sql file.
  2. Click File -> Append and select the second EnergyPlus sql file.

This will produce something like this:

image description

edit flag offensive delete link more

Comments

Thank you, I did not know about this feature! Now, I will need to see if I can open externally modified eplusout.sql files

mechyai's avatar mechyai  ( 2021-08-04 21:24:22 -0500 )edit
0

answered 2021-08-30 12:05:59 -0500

mechyai's avatar

A workaround I found for creating custom data for SQL output for DView is to use EMS and actuate an arbitrary Schedule:Constant. For instance, I wanted to track a reward metric for reinforcement learning control purposes during a simulation, so I created the schedule below

image description

And just actuated it with my desired reward values throughout my simulation using Python EMS.

edit flag offensive delete link more

Your Answer

Please start posting anonymously - your entry will be published after you log in or create a new account.

Add Answer

Careers

Question Tools

1 follower

Stats

Asked: 2021-08-03 14:03:09 -0500

Seen: 249 times

Last updated: Aug 30 '21