Question-and-Answer Resource for the Building Energy Modeling Community
Get started with the Help page
Ask Your Question
1

Generating weather file from one year measured data

asked 2020-10-22 17:53:21 -0500

Aly ElHefny's avatar

updated 2020-10-23 09:36:57 -0500

Hello Everyone, I hope you are all doing well and safe.

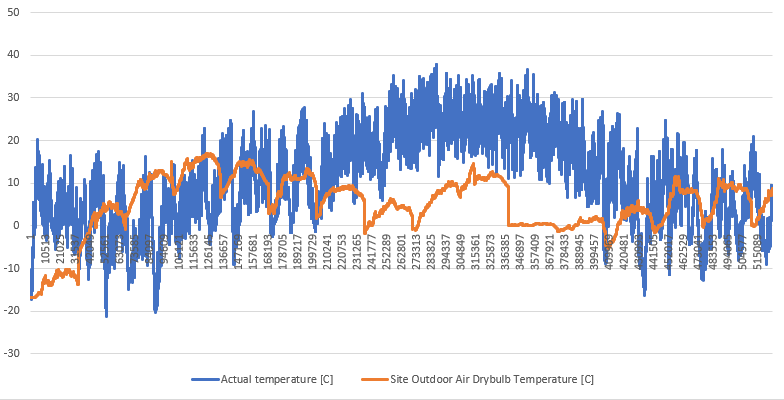
I'm trying to create an epw file out of real data to be used in an energyplus simulation. I have pasted my one year hour by hour outdoor air and solar data into the "Elements" tool and generated an epw file. I've also adjusted the location related inputs in Elements. To validate that, I have then used the file to run a simulation and output the outdoor conditions. They don't match, for example here is the site outdoor air temperature compared with my raw data. Temperatures compared

I would appreciate it if I can get some hints on that procedure. Thanks in advance

edit retag flag offensive close merge delete

Comments

1

Can you provide a link to your custom epw file? You can use Google Drive or Dropbox for example.

shorowit's avatar shorowit  ( 2020-10-23 09:36:18 -0500 )edit

Hello Shorowit, I hope you are well. Here is the custom weather file I generated by using NREL measured data of the Golden Colorado setup along with " elements " tool.

Custom_weather_file

Aly ElHefny's avatar Aly ElHefny  ( 2020-10-23 11:45:06 -0500 )edit
1

There is definitely something wrong with that file. If you view the file in, e.g., Dview (https://github.com/NREL/wex/releases/...), it shows that some variables are specified for the entire year and others just for the first month. And the temperatures match the EnergyPlus Site Outdoor Air Drybulb outputs.

shorowit's avatar shorowit  ( 2020-10-23 15:54:23 -0500 )edit

2 Answers

Sort by ยป oldest newest most voted
4

answered 2020-10-23 15:04:28 -0500

Can you confirm that the values look as expected after you paste them into Elements? Elements allows you to click on the column header and then click the Chart button to see a plot of the given attribute.

One thing that's tricky is that Elements is a relational editor. That is, Elements always seeks to enforce the relationships between weather variables. Therefore, when you paste into Elements, you need to take care of choosing an appropriate value for "Variables to Hold Constant". Order of operations may be important as well. For example, if you have atmospheric pressure, you may want to paste that column in first. There is a small tutorial here: https://bigladdersoftware.com/project...

If you have them, I would paste in the following order:

  • atmospheric pressure holding wet bulb and dry bulb constant
  • relative humidity holding dry bulb and atmospheric pressure constant
  • dry bulb holding relative humidity and atmospheric pressure constant

After each time you cut and paste, you can check that nothing changed by referring to the chart and comparing that to your source data.

If you are still having problems, you are welcome to email Elements support at elements@bigladdersoftware.com and we'd be happy to take a deeper look at it.

edit flag offensive delete link more
1

answered 2020-10-23 04:24:32 -0500

Joseph Yang's avatar

If your objective is to create EPW file for a specific location, it's better to use tools such as this: https://rokka.shinyapps.io/shinyweath... using reanalysis data because EPW file requires much more than just temperature data.

edit flag offensive delete link more

Comments

Hello Joseph, thank you for your reply. I will need to use real measured data that of a one minute resolution timestep.

Aly ElHefny's avatar Aly ElHefny  ( 2020-10-23 11:52:34 -0500 )edit

Your Answer

Please start posting anonymously - your entry will be published after you log in or create a new account.

Add Answer

Careers

Question Tools

2 followers

Stats

Asked: 2020-10-22 17:53:21 -0500

Seen: 495 times

Last updated: Oct 23 '20