Question-and-Answer Resource for the Building Energy Modeling Community
Get started with the Help page
Ask Your Question
2

How to plot times SimHVAC exceeded max iterations?

asked 2019-04-20 14:07:05 -0500

mldichter's avatar

updated 2019-04-22 16:58:20 -0500

I have a VAV system which is creating a bunch of warnings about convergence, but other unmethours posts indicate that these warnings may not be a problem. For instance, if the warning only occurs once a day when the HVAC system first turns on, then I think I can safely ignore the warnings. However, I don't know of an easy way to plot the times when all those warnings occur. Plots of Output:Variables and Output:Meters are extremely useful for diagnosing problems, and practical because everything is outputted to a CSV file, which is why I'm hoping to do the same with these SimHVAC warnings.

How do I output the times these SimHVAC warnings occur, and in general when warnings, severe errors, and fatal errors occur in a practical format like a CSV file?

Post Script
I tried out the Output:Variables @rraustad recommended and the SimHVAC error is happening pretty much every time step in the summer. So not just when the system turns on.

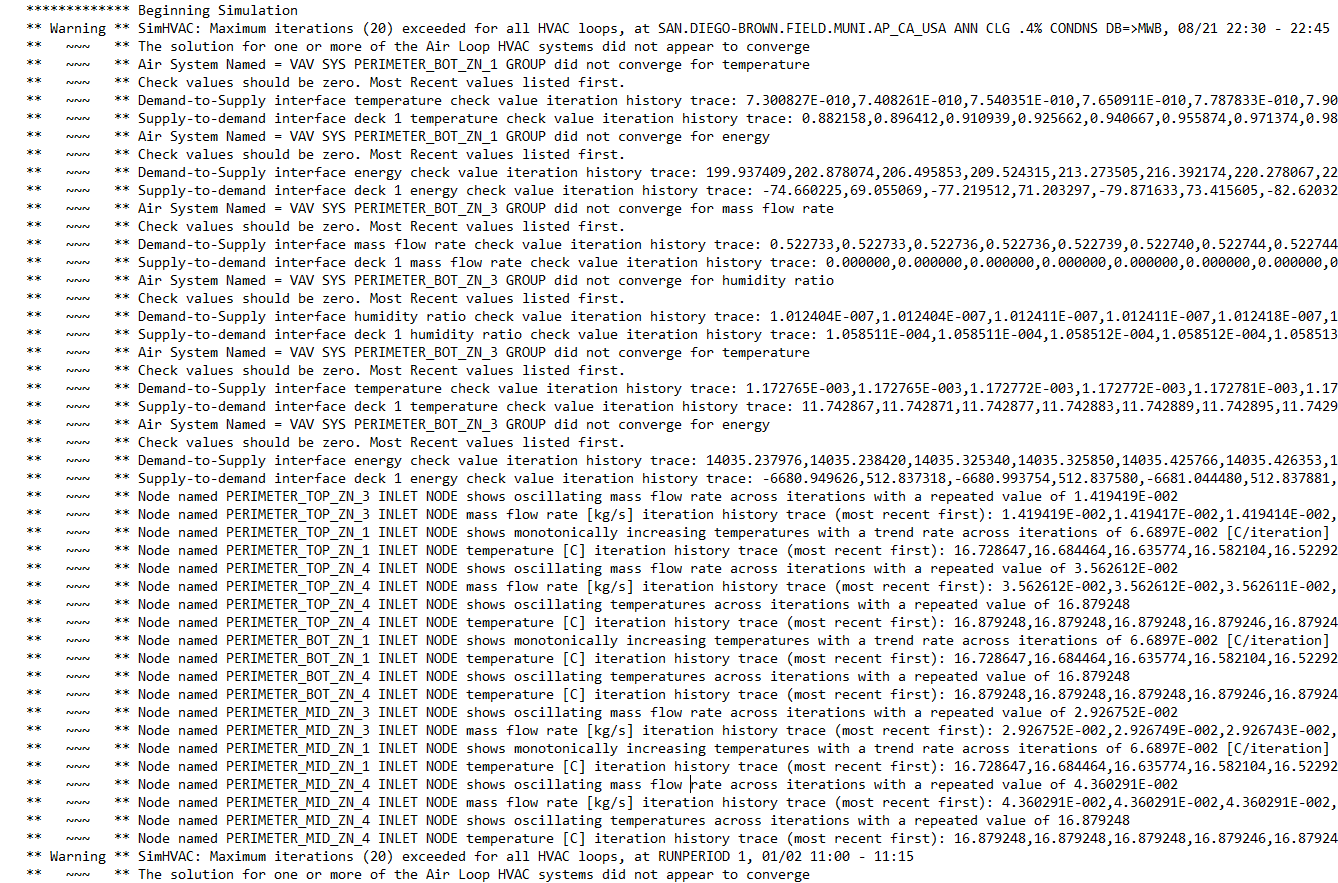
I don't mean to be the post that goes, "Something's wrong. Help!!!", but do you see anything obvious place to look in the idf file based on the error output. These error seems to repeat over and over again. If not, then I'll start going through all the objects field by field and hope I spot my incorrect value. (Errors included as an image so I'd get word wrap. Open image in a new tab to enlarge to readable sized text.)

image description

edit retag flag offensive close merge delete

1 Answer

Sort by ยป oldest newest most voted
3

answered 2019-04-22 07:39:33 -0500

There are a couple report variables that can be used for this purpose.

Output:Variable,*,Air System Simulation Maximum Iteration Count,Detailed;
Output:Variable,*,Air System Simulation Iteration Count,Detailed;
Output:Variable,*,Air System Component Model Simulation Calls,Detailed;

The warnings will typically have a timestamp of the first occurance. To minimize the amount of information reported to the err file, warnings are summarized at the end of the simulation to report the number of times they occurred and the range of values a specific parameter had when the warning occurs.

edit flag offensive delete link more

Comments

@rraustad The output variables showed the nonconvergence is happening way too often to ignore. Does anything jump out at you based on the errors I'm getting?

mldichter's avatar mldichter  ( 2019-04-22 16:59:37 -0500 )edit

Those check values mean roughly the same thing just in different terms/parameters. Look at the third one for mass flow rate. Your getting "a difference of" 0.52273 kg/s air flow at the demand outlet to supply inlet while the difference at the supply outlet to demand inlet = 0. So something is turning off, or resetting, or something at the inlet to the air loop or at the outlet of the demand (zone) loop.

rraustad's avatar rraustad  ( 2019-04-23 08:50:50 -0500 )edit

Your Answer

Please start posting anonymously - your entry will be published after you log in or create a new account.

Add Answer

Careers

Question Tools

1 follower

Stats

Asked: 2019-04-20 14:07:05 -0500

Seen: 184 times

Last updated: Apr 22 '19