Question-and-Answer Resource for the Building Energy Modeling Community
Get started with the Help page
Ask Your Question
1

Infiltration - Discrepancies between Output Report and Data Viewer

asked 2018-10-01 16:21:07 -0500

Lindsey Gaunt's avatar

updated 2018-10-01 16:53:41 -0500

Hi!

I am modeling a high rise residential apartment/office building in Openstudio v2.6 located in Seattle, WA. I am having trouble confirming the infiltration is simulated correctly. I've built a shoe box residential floor and a shoe box office floor and applied the appropriate multipliers to each. Seattle code require 0.034 cfm/ft2 max infiltration per exterior suface area, so I've modeled this according to the clip shown below.

image description

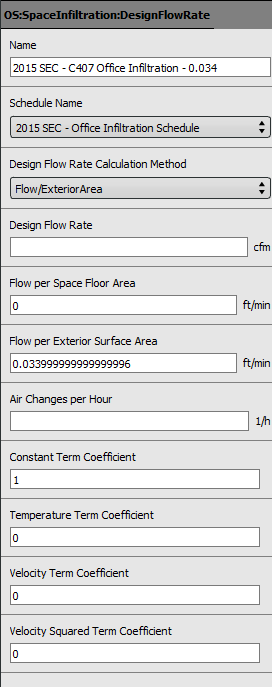
First of all, I'm assuming the units on Flow per Exterior Surface Area are a typo and should actually say cfm/ft^2 based on the units translated in the idf file.

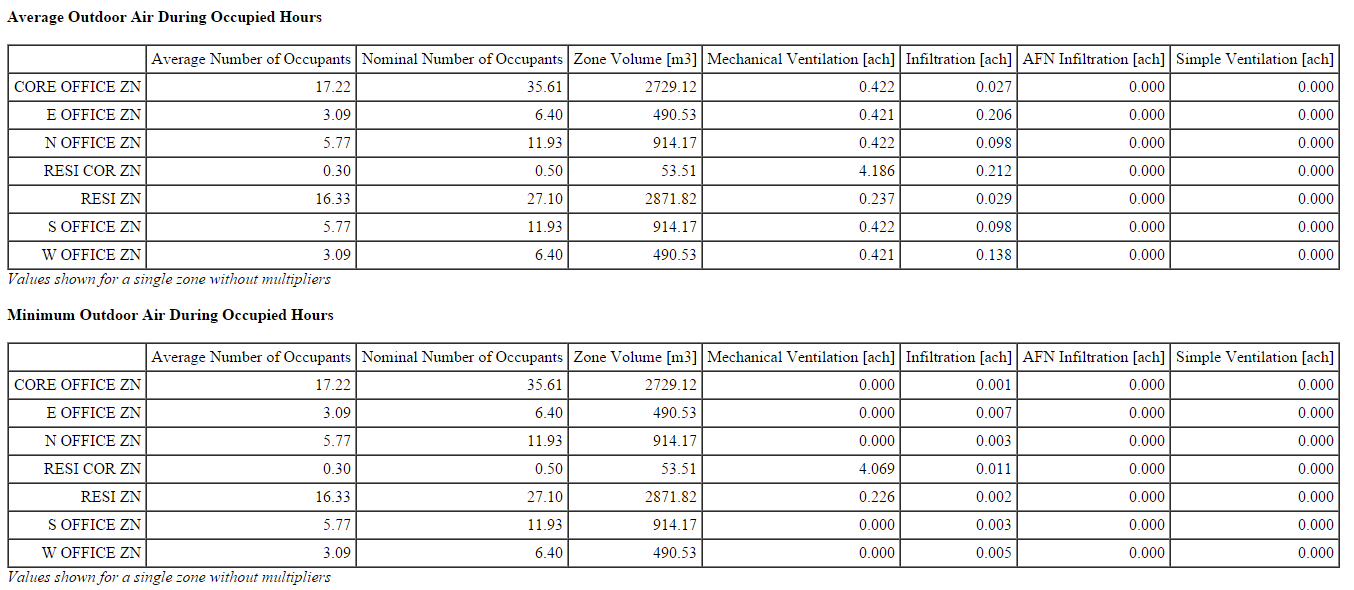
The discrepancy comes when I look at the plotted variable "Zone Infiltration Standard Density Volume Flow Rate" and the EnergyPlus Output table. The values shown in the table for average Infiltration ACH as well as the minimum Infiltration ACH do not line up with the values shown in the plotted graph. For example, looking at E Office Zn, the minimum Infiltration(ACH) is listed as 0.007 ACH, when the graph shows a minimum of 37cfm (0.125 ACH). Can anyone give me some insight on what these two variables mean?

image description

image description

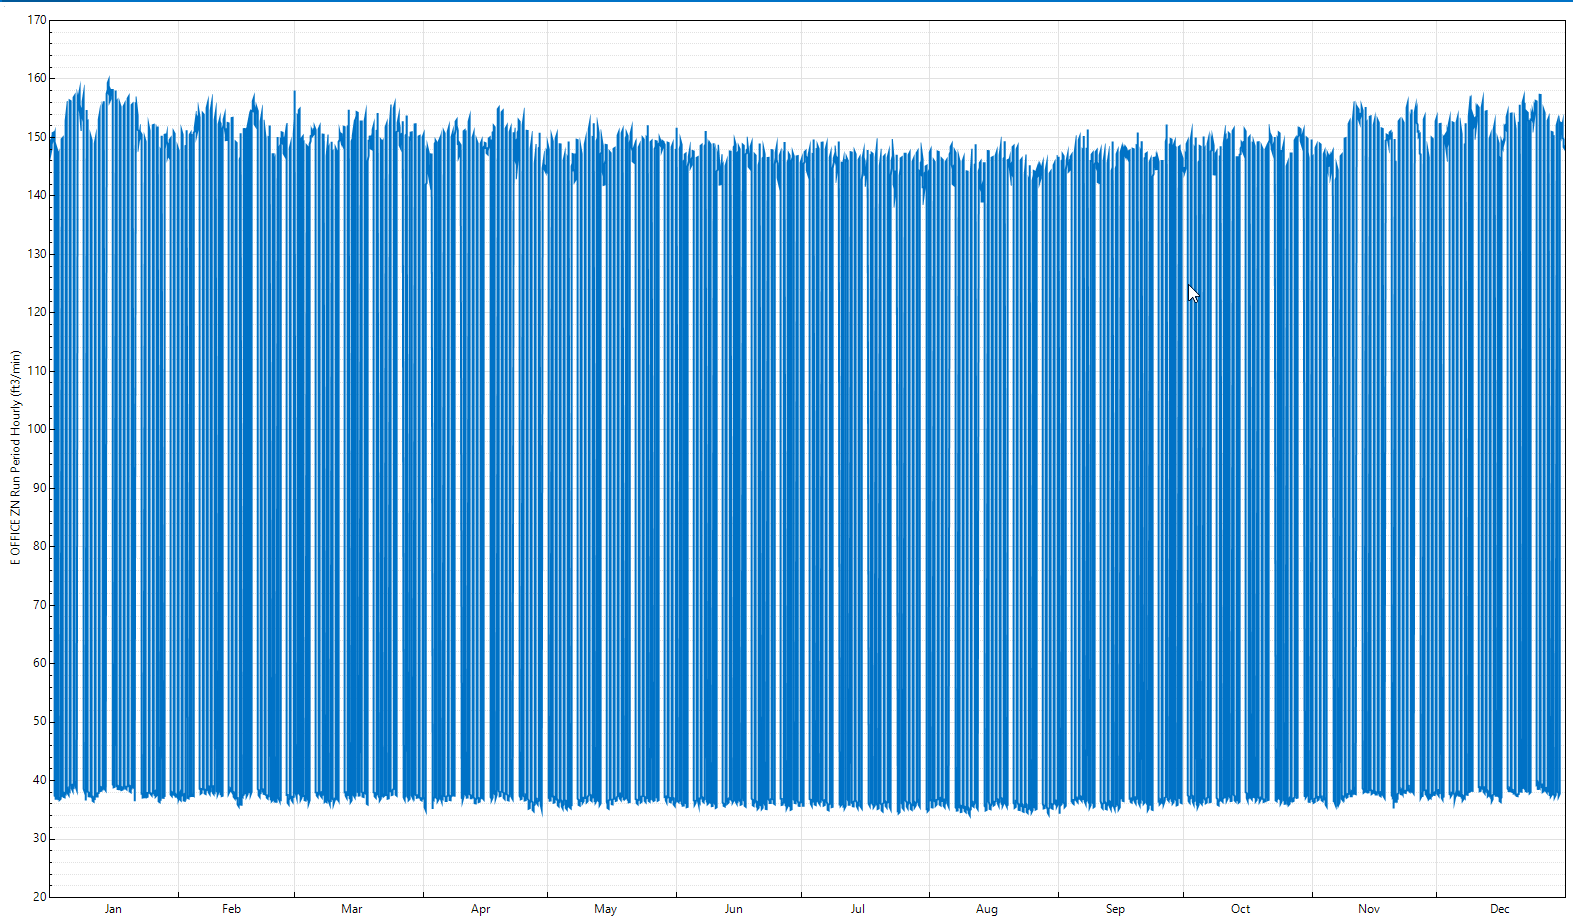
Another item I'd like confirmation on is whether the multiplier has been applied to the values shown in the graph or not. Because if so, the peak should be somewhere around 1000 cfm.

edit retag flag offensive close merge delete

1 Answer

Sort by ยป oldest newest most voted
1

answered 2018-10-03 15:58:25 -0500

The units of ft^3/min per ft^2 of exterior area, while not pretty, get reduced to ft/min by multiplying top and bottom by minutes, and then dividing each side by ft^2.

  • Looking at the average values for E office I see 490 m^3 x 0.206 ACH for roughly 100 m^3/hour of infiltration, or roughly 59 CFM.
  • For the minimum I show 490 m^3 x 0.07 ACH for roughly 34 m^3/hour or 20 CFM.

At first it seems strange that the minimum value from the table is lower than the time series plot, but my first question would be what is the simulation timestep and what is the plot timestep. It is possible the minimum just happens for a 10 minute time step, with that valley being lost in an hourly plot. The average value of 60 CFM does seem low at first given the range of 40 CFM to 150 CFM, but since that only represents the occupied average, when the HVAC system is on, there is probably a lower value in the infiltration schedule you have associated with the space infiltration design flow rate object.

It might be worth investigating "2015 SEC - Office Infiltration" schedule and creating a plot matching the simulation time step.

edit flag offensive delete link more

Your Answer

Please start posting anonymously - your entry will be published after you log in or create a new account.

Add Answer

Careers

Question Tools

1 follower

Stats

Asked: 2018-10-01 16:21:07 -0500

Seen: 241 times

Last updated: Oct 03 '18