Question-and-Answer Resource for the Building Energy Modeling Community
Get started with the Help page
Ask Your Question
5

Calibrating the model with PAT in hourly time step

asked 2018-09-20 04:00:08 -0600

rtsuchiya's avatar

updated 2018-09-20 10:58:41 -0600

Hello.

I am now considering how to calibrate the model using PAT cloud computing with EC2. I understood that PAT can do the multiple simulation and calibrate the model by energy consumption. But in my case I'd like to calibrate the model using observed room temperature (or/and humidity).

My idea is like;

image description

Here, I don't know how to get the CSV file of the best simulation's result generated by the measure "Export Variable To CSV". I'd like to know any kinds of tips to do this kind of experiment.

Thank you.

edit retag flag offensive close merge delete

3 Answers

Sort by ยป oldest newest most voted
5

answered 2018-09-20 11:33:30 -0600

updated 2018-09-21 08:34:34 -0600

@rtsuchiya I'll be speaking about time series calibration with OpenStudio at the SimBuild conference next week in Chicago.

I don't think I have the paper posted anywhere yet, but one of the measures we used, TimeSeries Objective Function, is on BCL and will create CVRMSE and NMBE values by comparing time series modeled SQL data against time series CSV measured data. It is setup to work for one or multiple run periods. You can just run this with LHS or some other sampling method and pick the best datapoint, or you can setup objectives function in PAT using the CVRMSE and/or NMBE values and choose an optimization algorithm.

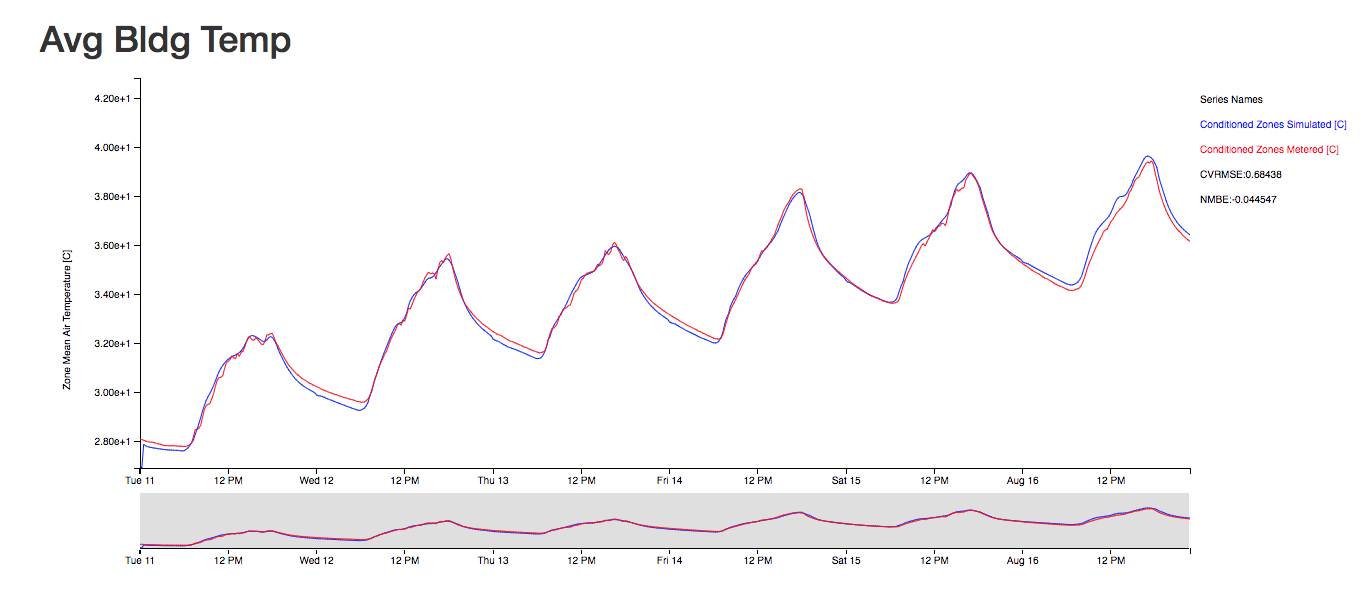
The measure is setup to map an EnergyPlus output variable to a single column in the measured data. You could grab temperatures for all of the individual zones. For a free oscillation (free float) calibration I created a variation on the measure to report a volume weighted average zone temperature and then created that same data in measured data. The image below is a 6 day calibration where plug loads were fixed from measured data and envelope characteristics were variables.

image description

Updated to show setup of CSV file in PAT:

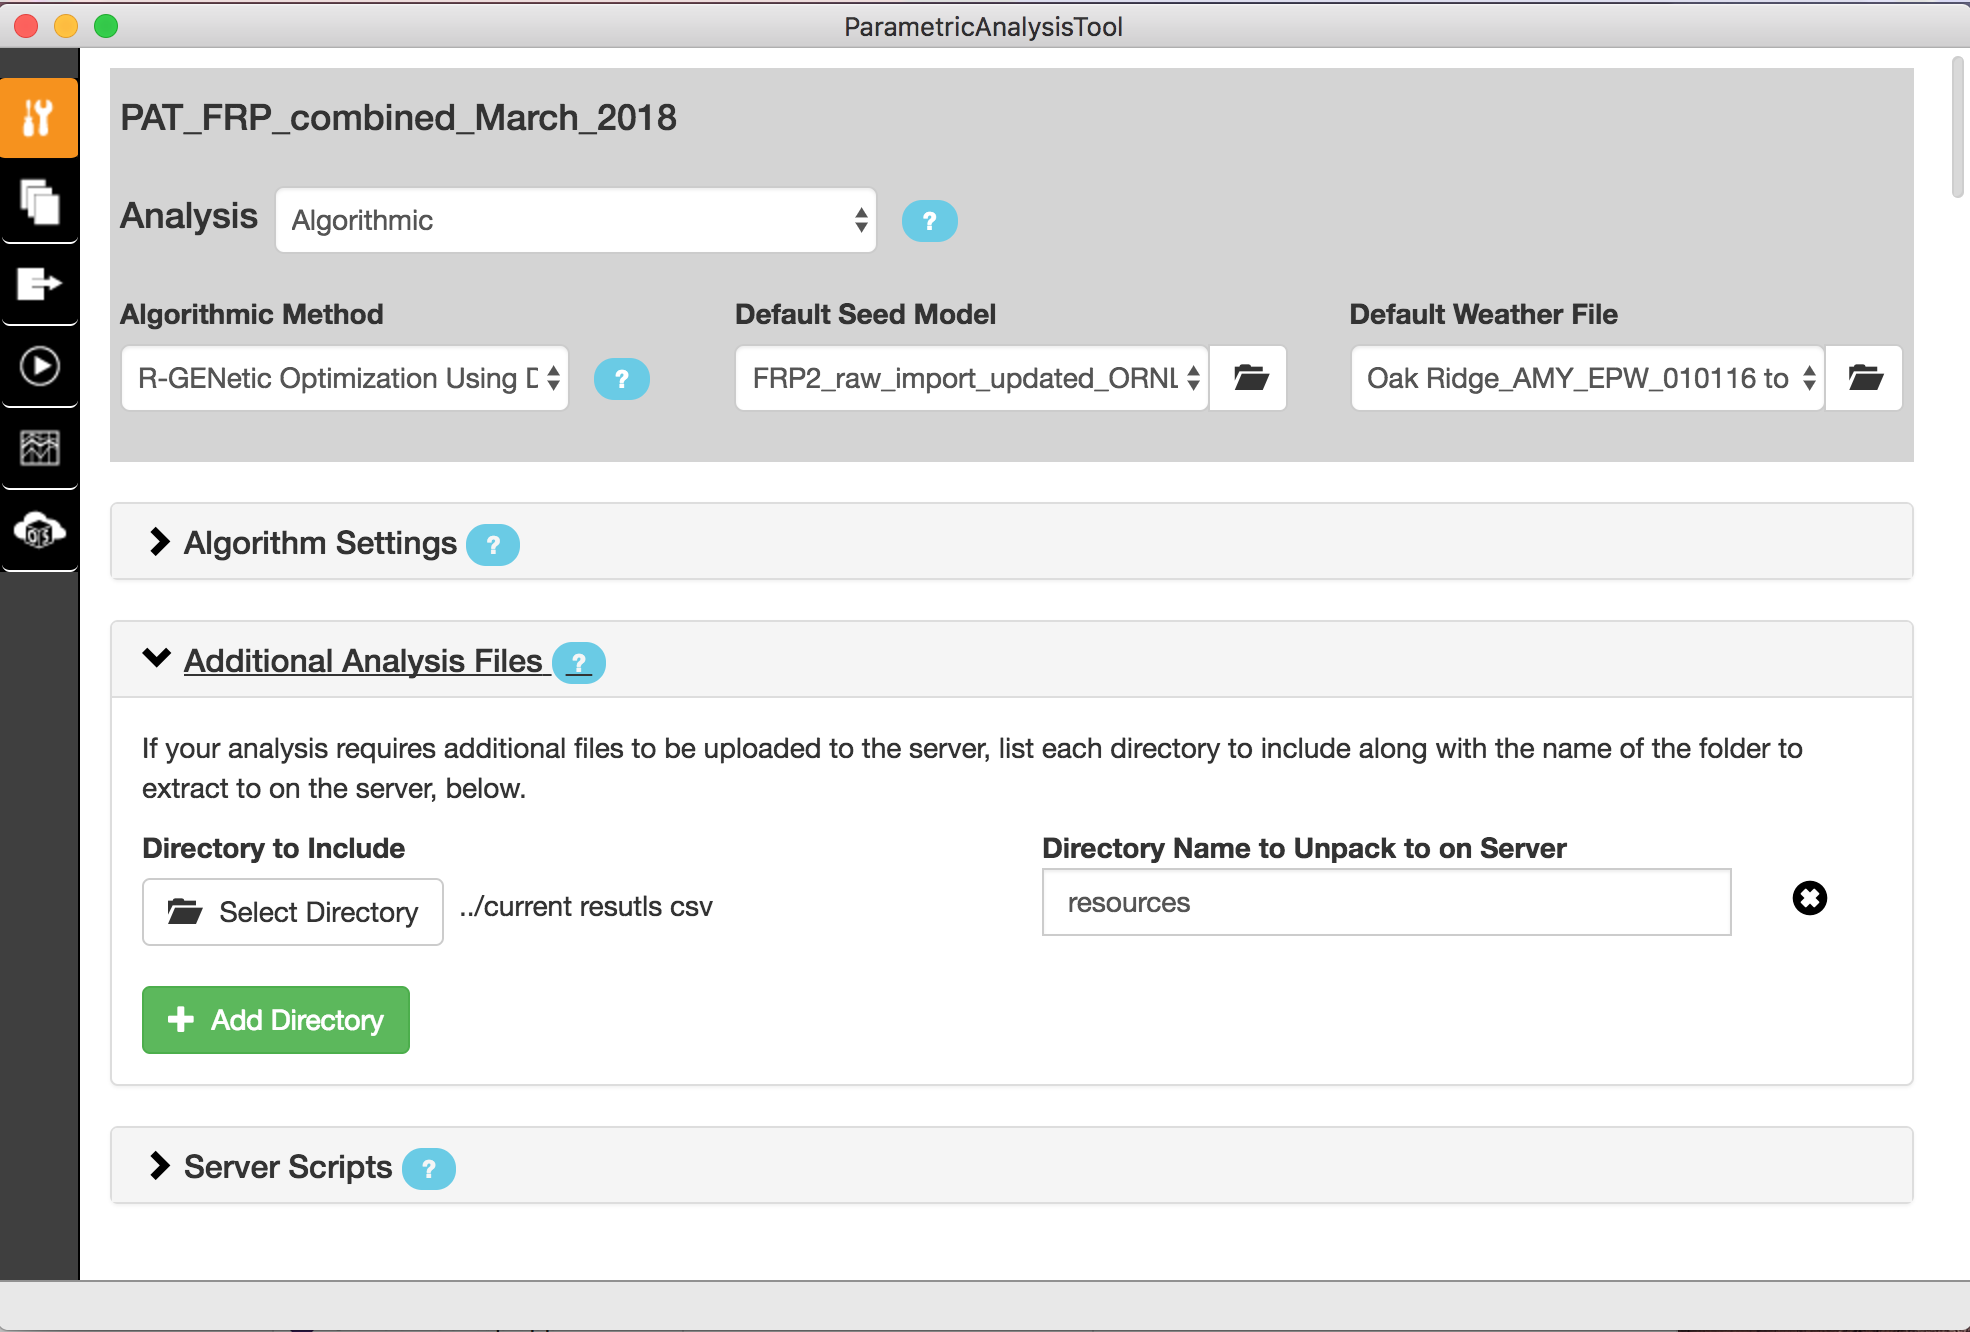
  1. Go to Algorithmic Mode and expand the "Additional Analysis Files" section. On the left browse to a local directory that contains the CSV file/s you want to access. These file can be outside of your PAT project.
  2. On the right create a name for directory on the server where you want the CSV file to be uploaded to. It is recommended to avoid spaces and special characters for this name.
  3. If you go back to manual model at this point, you will still have access to the selected files on the server.
  4. When referring to the file in a measure the path would look like ../../../lib/resources/your_data.csv. We plant to enhance PAT so no path is needed and just a file name would be entered, but for now you need a relative or absolute path.

image description

edit flag offensive delete link more

Comments

Thank you, I think this is just what I looked for. Is this the paper you mentioned?

I will try it!

rtsuchiya's avatar rtsuchiya  ( 2018-09-20 19:06:04 -0600 )edit
1

Yes, that is it.

David Goldwasser's avatar David Goldwasser  ( 2018-09-20 21:35:14 -0600 )edit

Hi, Dr.Goldwasser.

I would like you to ask how I can set the right location of measured csv file. I don't know how I can set "Path to CSV file for the metered data" when I use PAT with EC2 cloud computing.

I confirmed the measure successfully worked on OpenStudio.

I need your help to run the measure.

rtsuchiya's avatar rtsuchiya  ( 2018-09-21 05:09:38 -0600 )edit
1

@rtsuchiya that can be confusing, see the updated answer with screenshot of "Additional Analysis File".

David Goldwasser's avatar David Goldwasser  ( 2018-09-21 08:35:25 -0600 )edit

@David Goldwasser Thank you for the information. I tried as you explained but errors still remain.

Inputted informations are;

Directory to include: C:\OSPAT\ForPAT\use

Directory Name to Unpack to on Server: meter

Path to CSV file for the metered data: ../../../lib/resources/tmp.csv

The other parameters were not changed from the OS single simulation and I I confirmed error happened in the TimeSeries Objective Function measure. Could you have any fault in my inputted information?

rtsuchiya's avatar rtsuchiya  ( 2018-09-22 22:43:04 -0600 )edit
1

answered 2018-12-20 09:36:03 -0600

Vishak's avatar

Hello, I have been following this question and using the links posted by Dr. @David Goldwasser happened to simulate an hourly calibration. Currently, I am looking to bind hourly and monthly calibration together in a single PAT project. The sample project had the model being calibrated to multiple objective across a wide spectrum but all were on an hourly basis (correct me if I am wrong). My question is if calibration at two different interval levels can be accomplished using the two different instances of time series objective measure. If that is not possible, can a combination of normal monthly calibration process using 'AddJSONmonthlyUtilityData' and the hourly calibration process using 'TimeSeriesObjectiveFunction' work?

edit flag offensive delete link more

Comments

1

@Vishak It is possible, but can you post this as a new question about binding hourly and monthly calibration together. You can refer to this post in your question and include a link.

David Goldwasser's avatar David Goldwasser  ( 2018-12-20 10:08:05 -0600 )edit

Thanks, posting soon.

Vishak's avatar Vishak  ( 2018-12-20 11:15:36 -0600 )edit
1

answered 2024-07-25 03:15:56 -0600

Hello,

I understand that this topic has been discussed for years, but in case someone is still using the "TimeSeries Objective Function" to calibrate outputs that might occasionally or continuously contain negative values (such as thermal balance through enclosure like Surface Inside Face Conduction Heat Transfer Energy), it is important to modify the following portion of code to ensure the correct computation of NMBE and CVRMSE.

This modification calculates the absolute differential value:

Original code:

ySum += mtr.to_f

Modified code:

ySum += mtr.to_f.abs #use absolute number to avoid negative results

By using the absolute number, you can avoid negative results and ensure accurate calculations.

By the way, thank you very much for publishing such a measure!

edit flag offensive delete link more

Comments

Hi @jordibrunet, I've encountered this recently in some work, and I'm left to wonder if a different form of NMBE and CV(RMSE) would be better when positive and negative values are present. Specifically, one that, instead of using an absolute value in the denominator, uses the absolute difference between the minimum and maximum values in the reference data. In the case of validating something like heat flux predictions, you're likely to end up with an average very close to 0 and as a result very large error metrics for model predictions that otherwise may be fitting the data well.

GFlechas's avatar GFlechas  ( 2024-07-26 12:12:03 -0600 )edit

Your Answer

Please start posting anonymously - your entry will be published after you log in or create a new account.

Add Answer

Training Workshops

Careers

Question Tools

6 followers

Stats

Asked: 2018-09-20 04:00:08 -0600

Seen: 881 times

Last updated: Jul 25