Question-and-Answer Resource for the Building Energy Modeling Community
Get started with the Help page
Ask Your Question
5

Is there an efficient and interactive way to visualize and analyze EnergyPlus results?

asked 2017-11-28 10:37:23 -0600

oat's avatar

updated 2018-04-08 08:58:57 -0600

Is there an efficient and interactive way to visualize and analyze EnergyPlus results?

edit retag flag offensive close merge delete

1 Answer

Sort by ยป oldest newest most voted
6

answered 2017-11-28 10:49:08 -0600

oat's avatar

(... as advised by the admin, I can answer my own question, so...)

I have been thinking about this question for a while, and here is one solution I identified so far: Using Tableau to read the SQLite database generated from EnergyPlus simulation.

The work-in-progress workflow is documented in this link.

You are welcome to try it out, and your suggestions are also welcome.

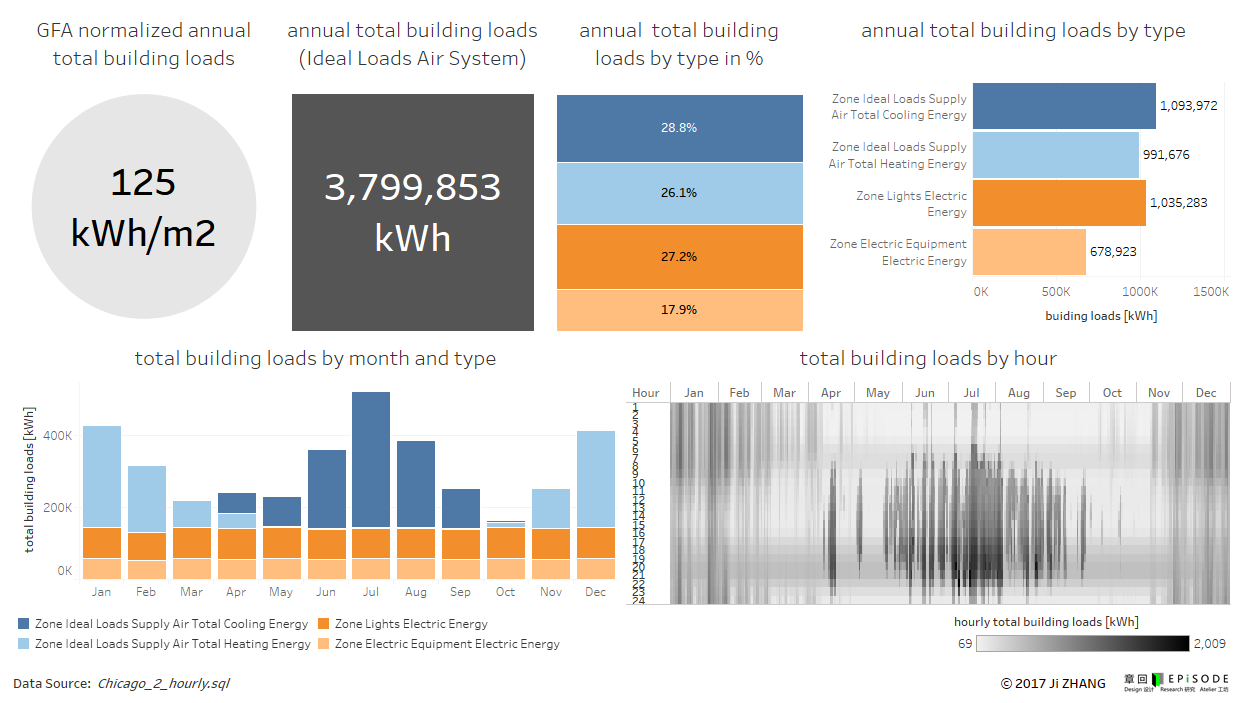
Here is the image of one of the example dashboards as provided in this workflow:

image description

edit flag offensive delete link more

Comments

Hi, Did you find a way to visualize and analyze EnergyPlus results?
nmo's avatar nmo  ( 2022-09-13 12:04:38 -0600 )edit

Your Answer

Please start posting anonymously - your entry will be published after you log in or create a new account.

Add Answer

Training Workshops

Careers

Question Tools

1 follower

Stats

Asked: 2017-11-28 10:37:23 -0600

Seen: 727 times

Last updated: Nov 28 '17